高级配置
前面我们一起学习了如何在 Prometheus Operator 下面自定义一个监控项,以及自定义报警规则的使用。那么我们还能够直接使用前面课程中的自动发现功能吗?如果在我们的 Kubernetes 集群中有了很多的 Service/Pod,那么我们都需要一个一个的去建立一个对应的 ServiceMonitor 对象来进行监控吗?这样岂不是又变得麻烦起来了?
自动发现配置
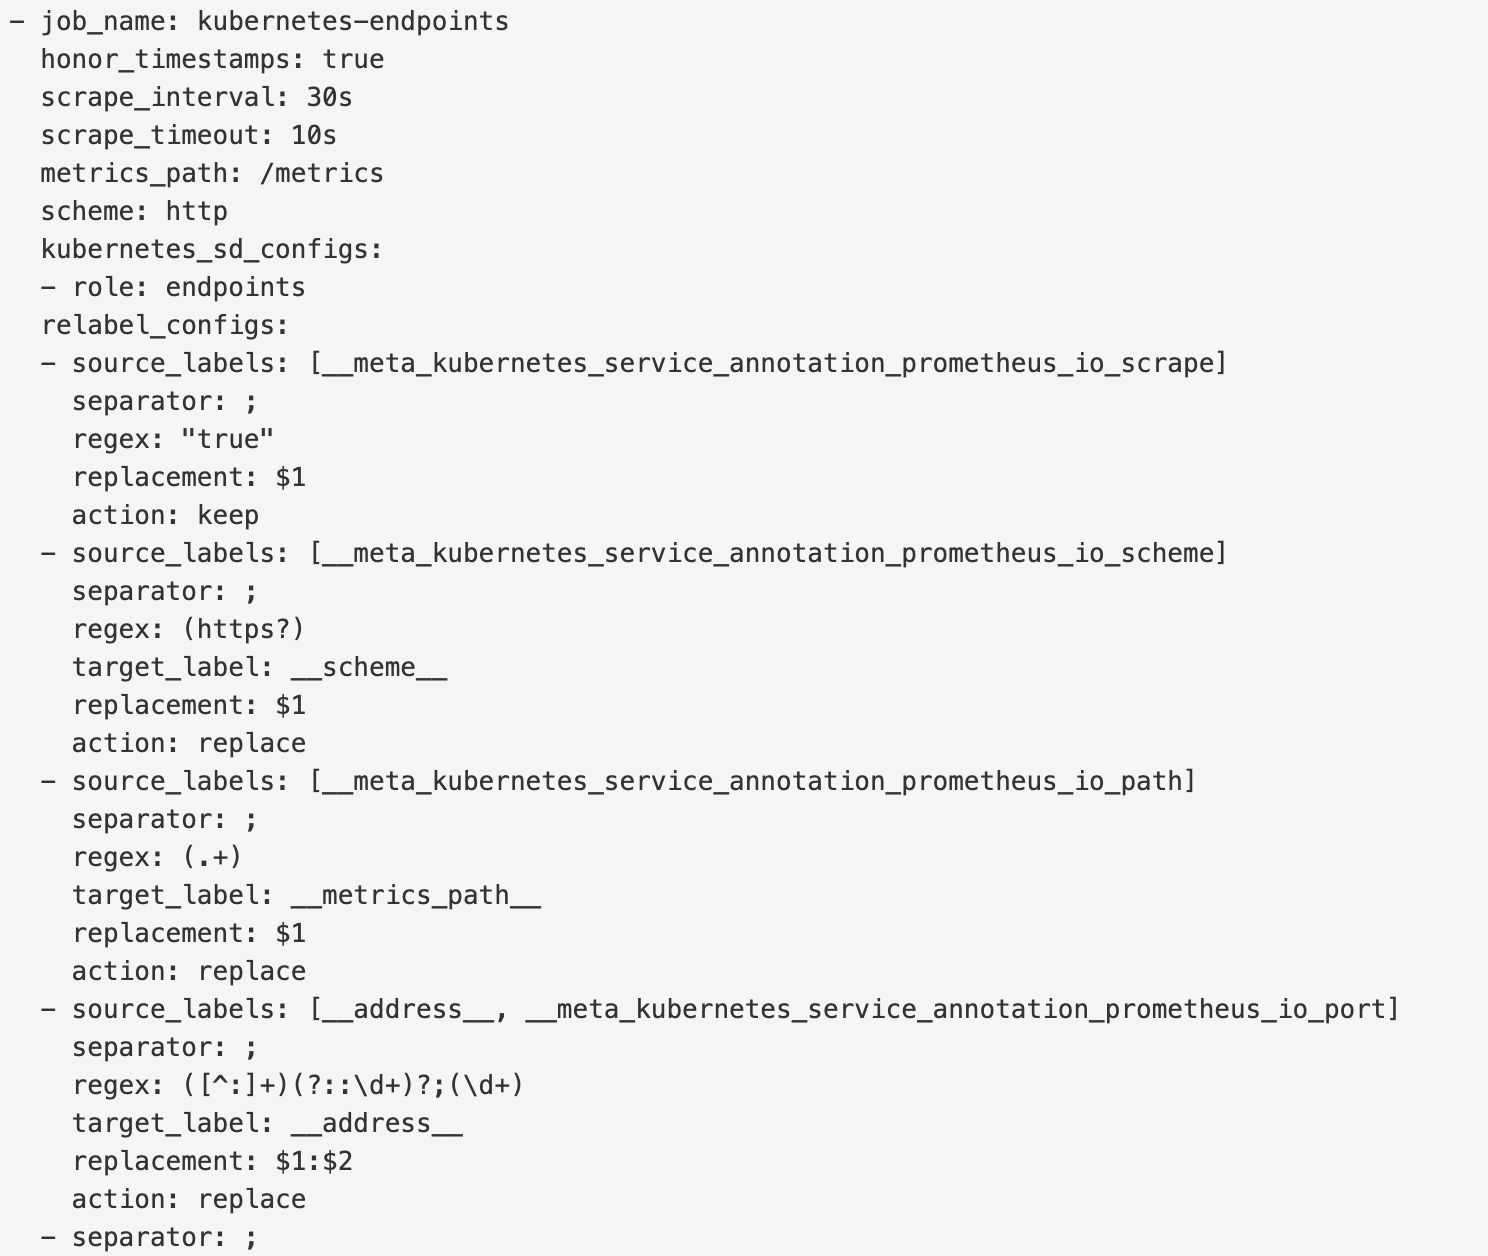
为解决上面的问题,Prometheus Operator 为我们提供了一个额外的抓取配置来解决这个问题,我们可以通过添加额外的配置来进行服务发现进行自动监控。和前面自定义的方式一样,我们可以在 Prometheus Operator 当中去自动发现并监控具有prometheus.io/scrape=true 这个 annotations 的 Service,之前我们定义的 Prometheus 的配置如下:
- job_name: "kubernetes-endpoints"
  kubernetes_sd_configs:
    - role: endpoints
  relabel_configs:
    - source_labels: [__meta_kubernetes_service_annotation_prometheus_io_scrape]
      action: keep
      regex: true
    - source_labels: [__meta_kubernetes_service_annotation_prometheus_io_scheme]
      action: replace
      target_label: __scheme__
      regex: (https?)
    - source_labels: [__meta_kubernetes_service_annotation_prometheus_io_path]
      action: replace
      target_label: __metrics_path__
      regex: (.+)
    - source_labels:
        [__address__, __meta_kubernetes_service_annotation_prometheus_io_port]
      action: replace
      target_label: __address__
      regex: ([^:]+)(?::\d+)?;(\d+)
      replacement: $1:$2
    - action: labelmap
      regex: __meta_kubernetes_service_label_(.+)
    - source_labels: [__meta_kubernetes_namespace]
      action: replace
      target_label: kubernetes_namespace
    - source_labels: [__meta_kubernetes_service_name]
      action: replace
      target_label: kubernetes_name
    - source_labels: [__meta_kubernetes_pod_name]
      action: replace
      target_label: kubernetes_pod_name
如果你对上面这个配置还不是很熟悉的话,建议去查看下前面关于 Kubernetes 常用资源对象监控章节的介绍,要想自动发现集群中的 Service,就需要我们在 Service 的 annotation 区域添加 prometheus.io/scrape=true 的声明,将上面文件直接保存为 prometheus-additional.yaml,然后通过这个文件创建一个对应的 Secret 对象:
$ kubectl create secret generic additional-configs --from-file=prometheus-additional.yaml -n monitoring
secret "additional-configs" created
然后我们需要在声明 prometheus 的资源对象文件中通过 additionalScrapeConfigs 属性添加上这个额外的配置:
# prometheus-prometheus.yaml
apiVersion: monitoring.coreos.com/v1
kind: Prometheus
metadata:
  labels:
    prometheus: k8s
  name: k8s
  namespace: monitoring
spec:
  alerting:
    alertmanagers:
      - name: alertmanager-main
        namespace: monitoring
        port: web
  image: prom/prometheus:v2.26.0 # 使用最新版本的镜像
  nodeSelector:
    kubernetes.io/os: linux
  podMonitorNamespaceSelector: {}
  podMonitorSelector: {}
  probeNamespaceSelector: {}
  probeSelector: {}
  replicas: 2
  resources:
    requests:
      memory: 400Mi
  ruleSelector: # 用来匹配rule规则的selector
    matchLabels: # 匹配的是具有下面两个标签的PrometheusRule这个资源对象
      prometheus: k8s
      role: alert-rules
  securityContext:
    fsGroup: 2000
    runAsNonRoot: true
    runAsUser: 1000
  serviceAccountName: prometheus-k8s
  serviceMonitorNamespaceSelector: {}
  serviceMonitorSelector: {}
  version: v2.26.0
  additionalScrapeConfigs:
    name: additional-configs
    key: prometheus-additional.yaml
关于 additionalScrapeConfigs 属性的具体介绍,我们可以使用 kubectl explain 命令来了解详细信息:
$ kubectl explain prometheus.spec.additionalScrapeConfigs
KIND:     Prometheus
VERSION:  monitoring.coreos.com/v1

RESOURCE: additionalScrapeConfigs <Object>

DESCRIPTION:
     AdditionalScrapeConfigs allows specifying a key of a Secret containing
     additional Prometheus scrape configurations. Scrape configurations
     specified are appended to the configurations generated by the Prometheus
     Operator. Job configurations specified must have the form as specified in
     the official Prometheus documentation:
     https://prometheus.io/docs/prometheus/latest/configuration/configuration/#scrape_config.
     As scrape configs are appended, the user is responsible to make sure it is
     valid. Note that using this feature may expose the possibility to break
     upgrades of Prometheus. It is advised to review Prometheus release notes to
     ensure that no incompatible scrape configs are going to break Prometheus
     after the upgrade.

FIELDS:
   key  <string> -required-
     The key of the secret to select from. Must be a valid secret key.

   name <string>
     Name of the referent. More info:
     https://kubernetes.io/docs/concepts/overview/working-with-objects/names/#names
     TODO: Add other useful fields. apiVersion, kind, uid?

   optional     <boolean>
     Specify whether the Secret or its key must be defined
添加完成后,直接更新 prometheus 这个 CRD 资源对象即可:
$ kubectl apply -f prometheus-prometheus.yaml
prometheus.monitoring.coreos.com "k8s" configured
隔一小会儿,可以前往 Prometheus 的 Dashboard 中查看配置已经生效了:
但是我们切换到 targets 页面下面却并没有发现对应的监控任务,查看 Prometheus 的 Pod 日志:
$ kubectl logs -f prometheus-k8s-0 prometheus -n monitoring
......
level=error ts=2020-04-18T02:38:27.800Z caller=klog.go:94 component=k8s_client_runtime func=ErrorDepth msg="/app/discovery/kubernetes/kubernetes.go:261: Failed to list *v1.Endpoints: endpoints is forbidden: User \"system:serviceaccount:monitoring:prometheus-k8s\" cannot list resource \"endpoints\" in API group \"\" at the cluster scope"
level=error ts=2020-04-18T02:38:27.801Z caller=klog.go:94 component=k8s_client_runtime func=ErrorDepth msg="/app/discovery/kubernetes/kubernetes.go:263: Failed to list *v1.Pod: pods is forbidden: User \"system:serviceaccount:monitoring:prometheus-k8s\" cannot list resource \"pods\" in API group \"\" at the cluster scope"
可以看到有很多错误日志出现,都是 xxx is forbidden,这说明是 RBAC 权限的问题,通过 prometheus 资源对象的配置可以知道 Prometheus 绑定了一个名为 prometheus-k8s 的 ServiceAccount 对象,而这个对象绑定的是一个名为 prometheus-k8s 的 ClusterRole:(prometheus-clusterRole.yaml)
apiVersion: rbac.authorization.k8s.io/v1
kind: ClusterRole
metadata:
  name: prometheus-k8s
rules:
  - apiGroups:
      - ""
    resources:
      - nodes/metrics
    verbs:
      - get
  - nonResourceURLs:
      - /metrics
    verbs:
      - get
上面的权限规则中我们可以看到明显没有对 Service 或者 Pod 的 list 权限,所以报错了,要解决这个问题,我们只需要添加上需要的权限即可:
apiVersion: rbac.authorization.k8s.io/v1
kind: ClusterRole
metadata:
  name: prometheus-k8s
rules:
  - apiGroups:
      - ""
    resources:
      - nodes
      - services
      - endpoints
      - pods
      - nodes/proxy
    verbs:
      - get
      - list
      - watch
  - apiGroups:
      - ""
    resources:
      - configmaps
      - nodes/metrics
    verbs:
      - get
  - nonResourceURLs:
      - /metrics
    verbs:
      - get
更新上面的 ClusterRole 这个资源对象,然后重建下 Prometheus 的所有 Pod,正常就可以看到 targets 页面下面有 kubernetes-endpoints 这个监控任务了: 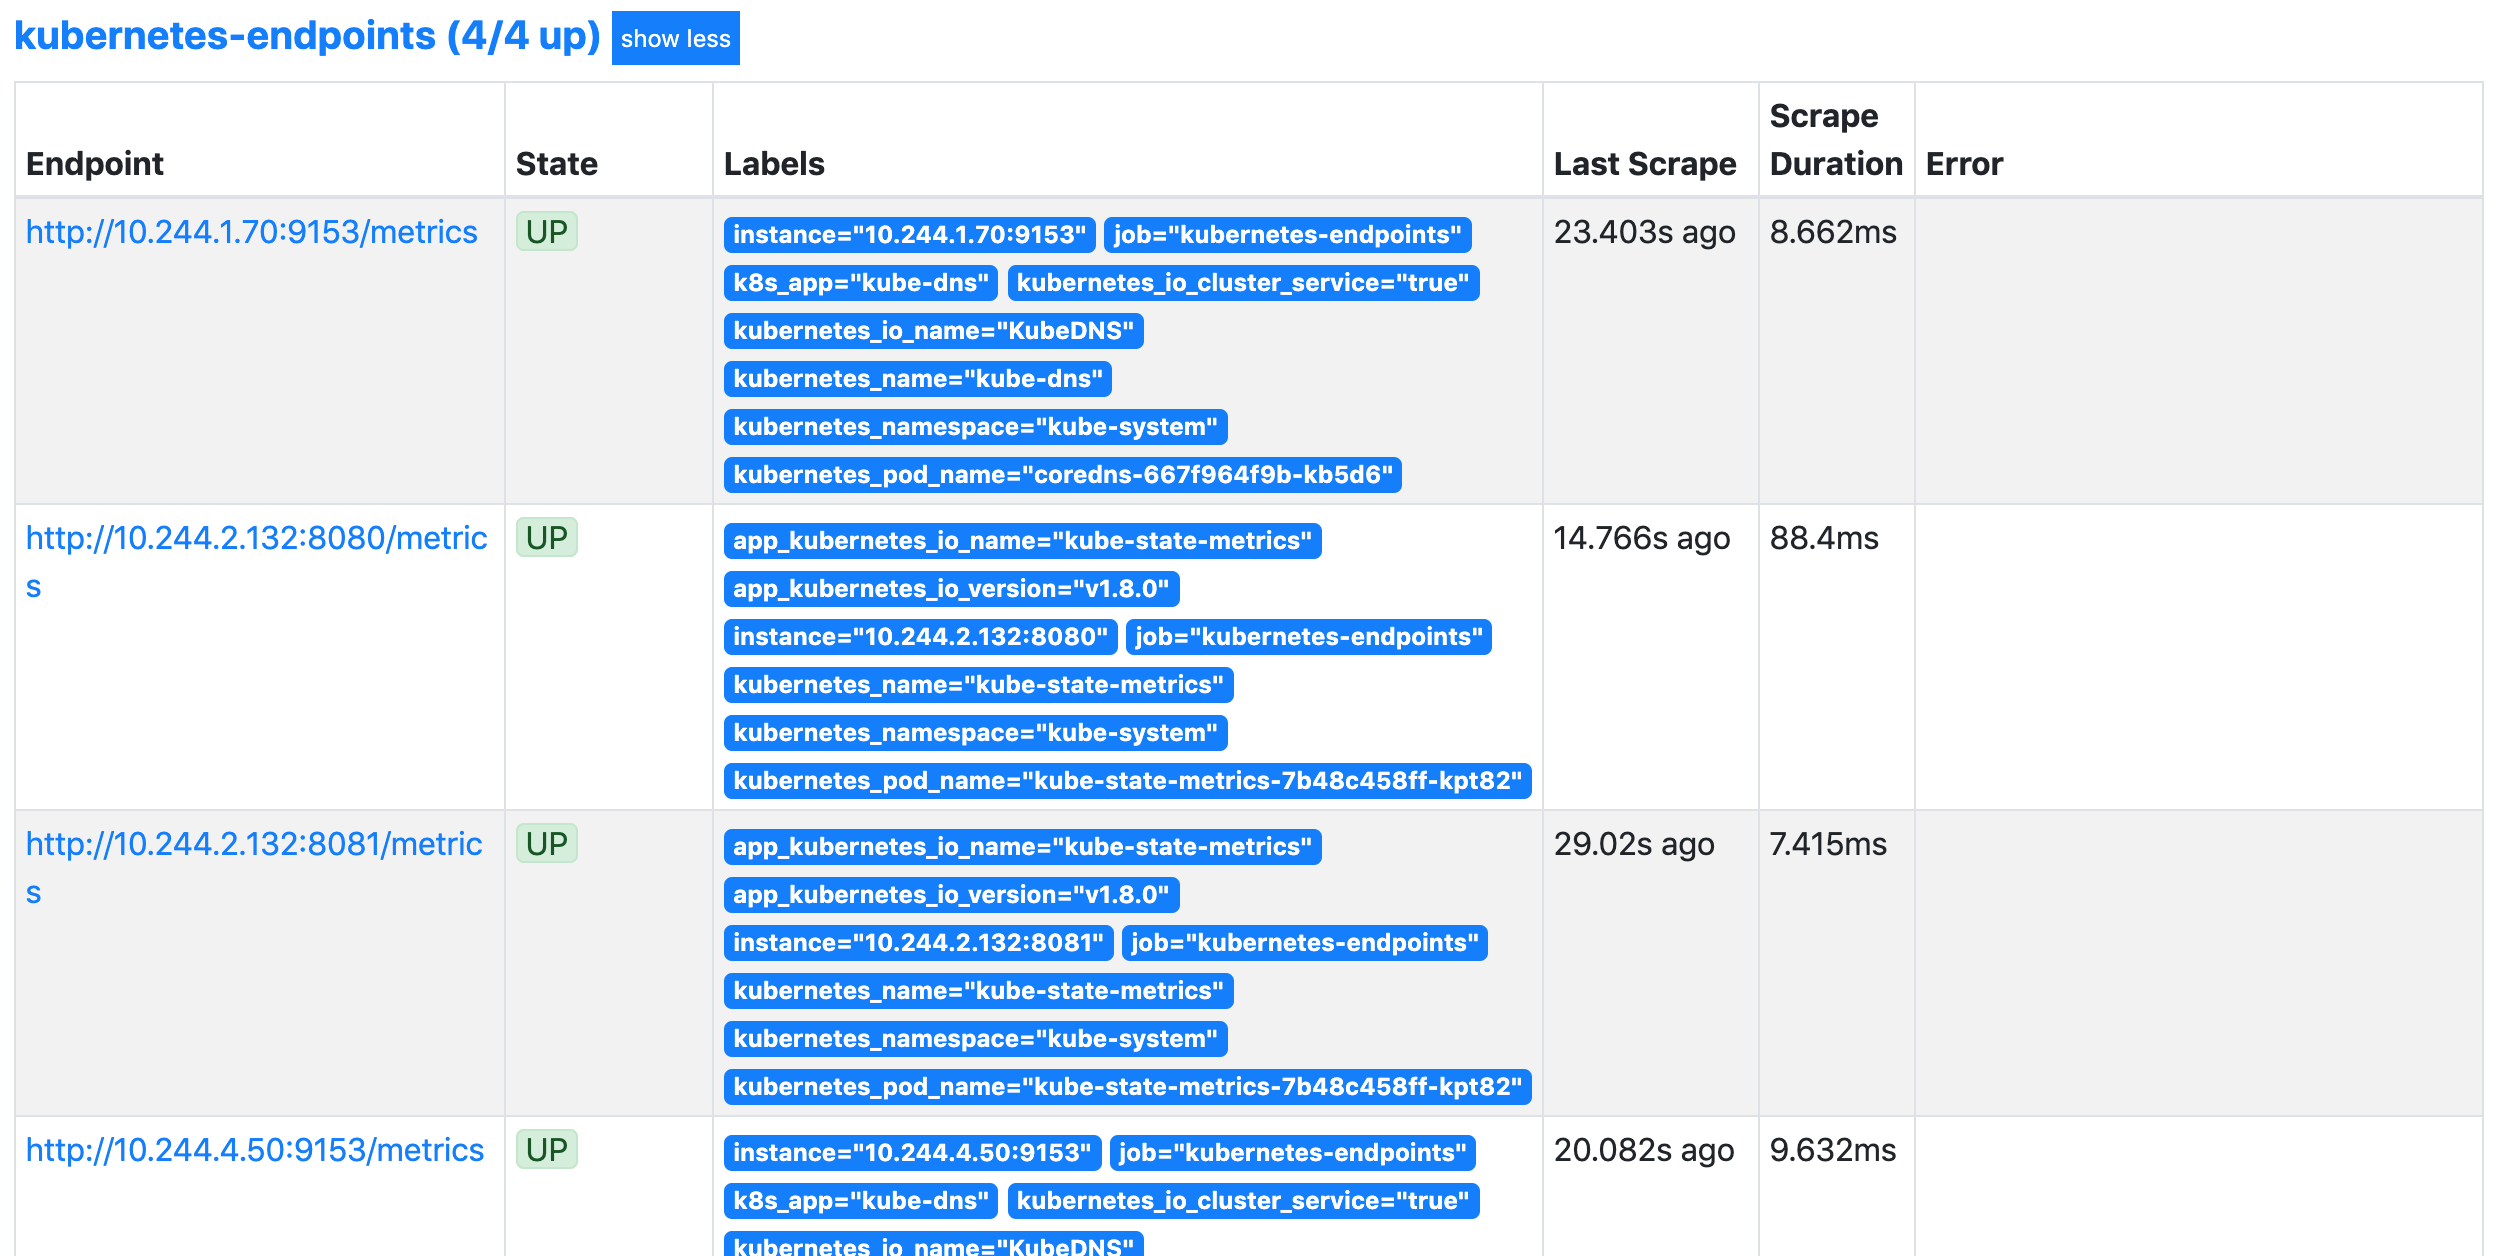
这里发现的几个抓取目标是因为 Service 中都有 prometheus.io/scrape=true 这个 annotation。
数据持久化
上面我们在修改完权限的时候,重启了 Prometheus 的 Pod,如果我们仔细观察的话会发现我们之前采集的数据已经没有了,这是因为我们通过 prometheus 这个 CRD 创建的 Prometheus 并没有做数据的持久化,我们可以直接查看生成的 Prometheus Pod 的挂载情况就清楚了:
$ kubectl get pod prometheus-k8s-0 -n monitoring -o yaml
......
    volumeMounts:
    - mountPath: /etc/prometheus/config_out
      name: config-out
      readOnly: true
    - mountPath: /prometheus
      name: prometheus-k8s-db
......
  volumes:
......
  - emptyDir: {}
    name: prometheus-k8s-db
......
我们可以看到 Prometheus 的数据目录 /prometheus 实际上是通过 emptyDir 进行挂载的,我们知道 emptyDir 挂载的数据的生命周期和 Pod 生命周期一致的,所以如果 Pod 挂掉了,数据也就丢失了,这也就是为什么我们重建 Pod 后之前的数据就没有了的原因,对应线上的监控数据肯定需要做数据的持久化的,同样的 prometheus 这个 CRD 资源也为我们提供了数据持久化的配置方法,由于我们的 Prometheus 最终是通过 Statefulset 控制器进行部署的,所以我们这里通过 storageclass 来做数据持久化,此外由于 Prometheus 本身对 NFS 存储没有做相关的支持,所以线上一定不要用 NFS 来做数据持久化,对于如何去为 prometheus 这个 CRD 对象配置存储数据,我们可以去查看官方文档 API,也可以用 kubectl explain 命令去了解:
$ kubectl explain prometheus.spec.storage
KIND:     Prometheus
VERSION:  monitoring.coreos.com/v1

RESOURCE: storage <Object>

DESCRIPTION:
     Storage spec to specify how storage shall be used.

FIELDS:
   emptyDir     <Object>
     EmptyDirVolumeSource to be used by the Prometheus StatefulSets. If
     specified, used in place of any volumeClaimTemplate. More info:
     https://kubernetes.io/docs/concepts/storage/volumes/#emptydir

   volumeClaimTemplate  <Object>
     A PVC spec to be used by the Prometheus StatefulSets.
所以我们在 prometheus 的 CRD 对象中通过 storage 属性配置 volumeClaimTemplate 对象即可:(prometheus-prometheus.yaml)
......
storage:
  volumeClaimTemplate:
    spec:
      storageClassName: rook-ceph-block
      resources:
        requests:
          storage: 20Gi
然后更新 prometheus 这个 CRD 资源,更新完成后会自动生成两个 PVC 和 PV 资源对象:
$ kubectl apply -f prometheus-prometheus.yaml
prometheus.monitoring.coreos.com/k8s configured
$ kubectl get pvc -n monitoring
NAME                                 STATUS   VOLUME                                     CAPACITY   ACCESS MODES   STORAGECLASS      AGE
prometheus-k8s-db-prometheus-k8s-0   Bound    pvc-79ad4856-2ab0-4445-814f-958a4699fab9   20Gi       RWO            rook-ceph-block   56s
prometheus-k8s-db-prometheus-k8s-1   Bound    pvc-8eae438e-bf7f-41a3-ae58-d7018c727866   20Gi       RWO            rook-ceph-block   55s
$ kubectl get pv |grep monitoring
pvc-79ad4856-2ab0-4445-814f-958a4699fab9   20Gi       RWO            Retain           Bound      monitoring/prometheus-k8s-db-prometheus-k8s-0          rook-ceph-block            90s
pvc-8eae438e-bf7f-41a3-ae58-d7018c727866   20Gi       RWO            Retain           Bound      monitoring/prometheus-k8s-db-prometheus-k8s-1          rook-ceph-block            90s
现在我们再去看 Prometheus Pod 的数据目录就可以看到是关联到一个 PVC 对象上了:
$ kubectl get pod prometheus-k8s-0 -n monitoring -o yaml
......
    volumeMounts:
    - mountPath: /etc/prometheus/config_out
      name: config-out
      readOnly: true
    - mountPath: /prometheus
      name: prometheus-k8s-db
......
  volumes:
......
  - name: prometheus-k8s-db
    persistentVolumeClaim:
      claimName: prometheus-k8s-db-prometheus-k8s-0
......
现在即使我们的 Pod 挂掉了,数据也不会丢失了。到这里 Prometheus Operator 的一些基本配置就算完成了,对于大型的监控集群还需要做一些其他配置,比如前面我们学习的使用 Thanos 来做 Prometheus 集群的高可用已经数据远程存储,对于 Prometheus Operator 来说,要配置 Thanos 也比较简单,因为 prometheus 这个 CRD 对象本身也支持的:
$ kubectl explain prometheus.spec.thanos
KIND:     Prometheus
VERSION:  monitoring.coreos.com/v1

RESOURCE: thanos <Object>

DESCRIPTION:
     Thanos configuration allows configuring various aspects of a Prometheus
     server in a Thanos environment. This section is experimental, it may change
     significantly without deprecation notice in any release. This is
     experimental and may change significantly without backward compatibility in
     any release.

FIELDS:
   baseImage    <string>
     Thanos base image if other than default.

   grpcServerTlsConfig  <Object>
     GRPCServerTLSConfig configures the gRPC server from which Thanos Querier
     reads recorded rule data. Note: Currently only the CAFile, CertFile, and
     KeyFile fields are supported. Maps to the '--grpc-server-tls-*' CLI args.

   image        <string>
     Image if specified has precedence over baseImage, tag and sha combinations.
     Specifying the version is still necessary to ensure the Prometheus Operator
     knows what version of Thanos is being configured.

   listenLocal  <boolean>
     ListenLocal makes the Thanos sidecar listen on loopback, so that it does
     not bind against the Pod IP.

   objectStorageConfig  <Object>
     ObjectStorageConfig configures object storage in Thanos.

   resources    <Object>
     Resources defines the resource requirements for the Thanos sidecar. If not
     provided, no requests/limits will be set

   sha  <string>
     SHA of Thanos container image to be deployed. Defaults to the value of
     `version`. Similar to a tag, but the SHA explicitly deploys an immutable
     container image. Version and Tag are ignored if SHA is set.

   tag  <string>
     Tag of Thanos sidecar container image to be deployed. Defaults to the value
     of `version`. Version is ignored if Tag is set.

   tracingConfig        <Object>
     TracingConfig configures tracing in Thanos. This is an experimental
     feature, it may change in any upcoming release in a breaking way.

   version      <string>
     Version describes the version of Thanos to use.
关于 prometheus operator 中如何配置 thanos,可以查看官方文档的介绍:https://github.com/coreos/prometheus-operator/blob/master/Documentation/thanos.md。
我们可以看到上面的属性中有一个 objectStorageConfig 字段,该字段也就是用来指定对象存储相关配置的,这里同样我们使用前面 Thanos 章节中的对象存储配置即可:(thanos-storage-minio.yaml)
type: s3
config:
  bucket: promethes-operator-data # 记得在 minio 中创建这个 bucket
  endpoint: minio.minio.svc.cluster.local:9000
  access_key: minio
  secret_key: minio123
  insecure: true
  signature_version2: false
使用上面的配置文件创建一个对应的 Secret 资源对象:
$ kubectl -n monitoring create secret generic thanos-objectstorage --from-file=thanos.yaml=thanos-storage-minio.yaml
secret/thanos-objectstorage created
创建完成后在 prometheus 的 CRD 对象中添加如下配置:(prometheus-prometheus.yaml )
thanos:
  objectStorageConfig:
    key: thanos.yaml
    name: thanos-objectstorage
然后直接更新 prometheus 这个 CRD 对象即可:
$ kubectl apply -f prometheus-prometheus.yaml
prometheus.monitoring.coreos.com/k8s configured
$ kubectl get pods -n monitoring -l app=prometheus
NAME               READY   STATUS    RESTARTS   AGE
prometheus-k8s-0   4/4     Running   1          11m
prometheus-k8s-1   4/4     Running   0          11m
更新完成后,可以看到 Prometheus 的 Pod 变成了 4 个容器,新增了一个 sidecar 容器:
$ kubectl get pod prometheus-k8s-0 -n monitoring -o yaml
......
  - args:
    - sidecar
    - --prometheus.url=http://localhost:9090/
    - --tsdb.path=/prometheus
    - --grpc-address=[$(POD_IP)]:10901
    - --http-address=[$(POD_IP)]:10902
    - --objstore.config=$(OBJSTORE_CONFIG)
    env:
    - name: POD_IP
      valueFrom:
        fieldRef:
          apiVersion: v1
          fieldPath: status.podIP
    - name: OBJSTORE_CONFIG
      valueFrom:
        secretKeyRef:
          key: thanos.yaml
          name: thanos-objectstorage
    image: quay.io/thanos/thanos:v0.11.0
    imagePullPolicy: IfNotPresent
    name: thanos-sidecar
    ports:
    - containerPort: 10902
      name: http
      protocol: TCP
    - containerPort: 10901
      name: grpc
      protocol: TCP
......
这个其实和前面课程中学习的手动方式部署 Thanos 非常类似,现在相当于我们将 Prometheus 的数据输出到了远程对象存储上面去了,但是这还只是第一步,我们还需要部署其他的 Thanos 组件,比如 Querier、Store、Compactor 等,这些内容其实前面章节我们已经详细讲解过了,这里我们就不再赘述了。
最后我们查看下面我们的 prometheus 的 CRD 对象的完整配置:
apiVersion: monitoring.coreos.com/v1
kind: Prometheus
metadata:
  labels:
    prometheus: k8s
  name: k8s
  namespace: monitoring
spec:
  alerting:
    alertmanagers:
      - name: alertmanager-main
        namespace: monitoring
        port: web
  image: prom/prometheus:v2.26.0
  nodeSelector:
    kubernetes.io/os: linux
  podMonitorNamespaceSelector: {}
  podMonitorSelector: {}
  replicas: 2
  retention: 6h # 本地只保留6h小时的数据
  resources:
    requests:
      memory: 400Mi
  ruleSelector:
    matchLabels:
      prometheus: k8s
      role: alert-rules
  securityContext:
    fsGroup: 2000
    runAsNonRoot: true
    runAsUser: 1000
  serviceAccountName: prometheus-k8s
  serviceMonitorNamespaceSelector: {}
  serviceMonitorSelector: {}
  version: v2.26.0
  additionalScrapeConfigs: # 添加服务发现的配置
    name: additional-configs
    key: prometheus-additional.yaml
  storage: # 添加本地数据持久化
    volumeClaimTemplate:
      spec:
        storageClassName: rook-ceph-block
        resources:
          requests:
            storage: 20Gi
  thanos: #  添加 thanos 配置
    objectStorageConfig:
      key: thanos.yaml
      name: thanos-objectstorage # 对象存储对应的 secret 资源对象
当然如果最后配置了 Thanos,那么 Grafana 的数据源也需要更改成 Querier 组件的地址,否则就只是本地的数据。