Prometheus 高可用
前面我们已经学习了 Prometheus 的使用,了解了基本的 PromQL 语句以及结合 Grafana 来进行监控图表展示,通过 Alertmanager 来进行报警,这些工具结合起来已经可以帮助我们搭建一套比较完整的监控报警系统了,但是也仅仅局限于测试环境,对于生产环境来说则还有许多需要改进的地方,其中一个非常重要的就是 Prometheus 的高可用。
单台的 Prometheus 存在单点故障的风险,随着监控规模的扩大,Prometheus 产生的数据量也会非常大,性能和存储都会面临问题。毋庸置疑,我们需要一套高可用的 Prometheus 集群。
可用性
我们知道 Prometheus 是采用的 Pull 机制获取监控数据,即使使用 Push Gateway 对于 Prometheus 也是 Pull,为了确保 Prometheus 服务的可用性,我们只需要部署多个 Prometheus 实例,然后采集相同的 metrics 数据即可,如下图所示:
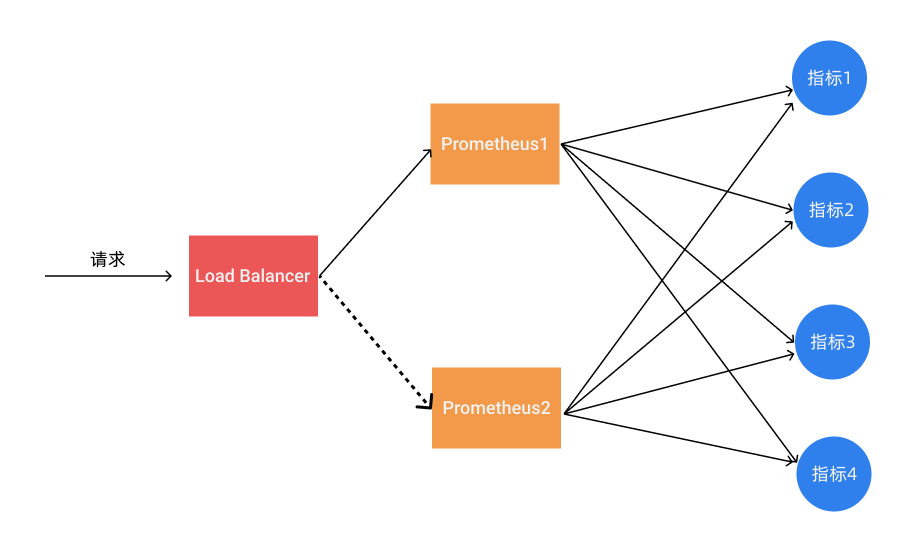
这个方式来满足服务的可用性应该是平时我们使用得最多的一种方式,当一个实例挂掉后从 LB 里面自动剔除掉,而且还有负载均衡的作用,可以降低一个 Prometheus 的压力,但这种模式缺点也是非常明显的,就是不满足数据一致性以及持久化问题,因为 Prometheus 是 Pull 的方式,即使多个实例抓取的是相同的监控指标,也不能保证抓取过来的值就是一致的,更何况在实际的使用过程中还会遇到一些网络延迟问题,所以会造成数据不一致的问题,不过对于监控报警这个场景来说,一般也不会要求数据强一致性,所以这种方式从业务上来说是可以接受的,因为这种数据不一致性影响基本上没什么影响。这种场景适合监控规模不大,只需要保存短周期监控数据的场景。
数据持久化
使用上面的基本 HA 的模式基本上是可以满足监控这个场景,但是还有一个数据持久化的问题,如果其中一个实例数据丢了就没办法呢恢复回来了,这个时候我们就可以为 Prometheus 添加远程存储来保证数据持久化。
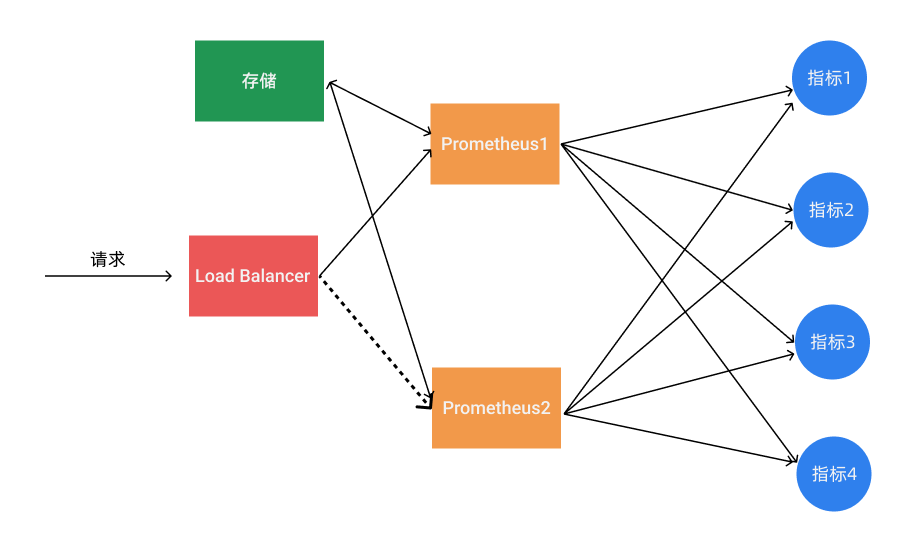
在给 Prometheus 配置上远程存储过后,我们就不用担心数据丢失的问题了,即使当一个 Prometheus 实例宕机或者数据丢失过后,也可以通过远程存储的数据进行恢复。
通过锁获取 Leader
其实上面的基本 HA 加上远程存储的方式基本上可以满足 Prometheus 的高可用了,这种方式的多个 Prometheus 实例都会去定时拉取监控指标数据,然后将热数据存储在本地,然后冷数据同步到远程存储中去,对于大型集群来说频繁的去拉取指标数据势必会对网络造成更大的压力。所以我们也通过服务注册的方式来实现 Prometheus 的高可用性,集群启动的时候每个节点都尝试去获取锁,获取成功的节点成为 Leader 执行任务,若主节点宕机,从节点获取锁成为 Leader 并接管服务。

不过这种方案需要我们通过去写代码进行改造,如果在 Kubernetes 中我们完全可以使用自带的 Lease 对象来获取分布式锁 🔒,这不是很困难,只是以后要更新版本稍微麻烦点。
上面的几种方案基本上都可以满足基本的 Prometheus 高可用,但是对于大型集群来说,一个 Prometheus 实例的压力始终非常大。
联邦集群
当单个 Promthues 实例无法处理大量的采集任务时,这个时候我们就可以使用基于 Prometheus 联邦集群的方式来将监控任务划分到不同的 Prometheus 实例中去。
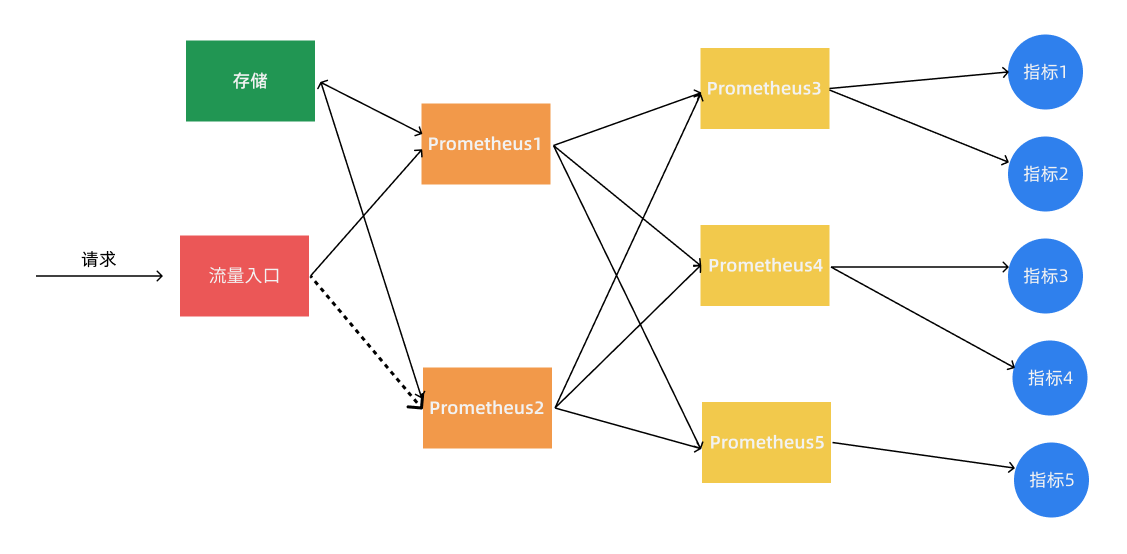
我们可以将不同类型的采集任务划分到不同的 Prometheus 实例中去执行,进行功能分片,比如一个 Prometheus 负责采集节点的指标数据,另外一个 Prometheus 负责采集应用业务相关的监控指标数据,最后在上层通过一个 Prometheus 对数据进行汇总。
具体的采集任务如何去进行分区也没有固定的标准,需要结合实际的业务进行考虑,除了上面的方式之外,还有一种情况就是单个的采集数据量就非常非常大,比如我们要采集上万个节点的监控指标数据,这种情况即使我们已经进行了分区,但是对于单个 Prometheus 来说压力也是非常大的,这个时候我们就需要按照任务的不同实例进行划分,我们通过 Prometheus 的 relabel 功能,通过 hash 取模的方式可以确保当前 Prometheus 只采集当前任务的一部分实例的监控指标。
# 省略其他配置......
relabel_configs:
  - source_labels: [__address__]
    modulus: 4 # 将节点分片成 4 个组
    target_label: __tmp_hash
    action: hashmod
  - source_labels: [__tmp_hash]
    regex: ^1$ # 只抓第2个组中节点的数据(序号0为第1个组)
    action: keep
到这里我们基本上就完成了 Prometheus 高可用的改造。对于小规模集群和大规模集群可以采用不同的方案,但是其中有一个非常重要的部分就是远程存储,我们需要保证数据的持久化就必须使用远程存储。所以下面我们将重点介绍下远程存储的时候,这里我们主要讲解目前比较流行的方案:Thanos,它完全兼容 Prometheus API,提供统一查询聚合分布式部署 Prometheus 数据的能力,同时也支持数据长期存储到各种对象存储(比如 S3、阿里云 OSS 等)以及降低采样率来加速大时间范围的数据查询。
Thanos
Thanos 是一个基于 Prometheus 实现的监控方案,其主要设计目的是解决原生 Prometheus 上的痛点,并且做进一步的提升,主要的特性有:全局查询,高可用,动态拓展,长期存储。下图是 Thanos 官方的架构图:
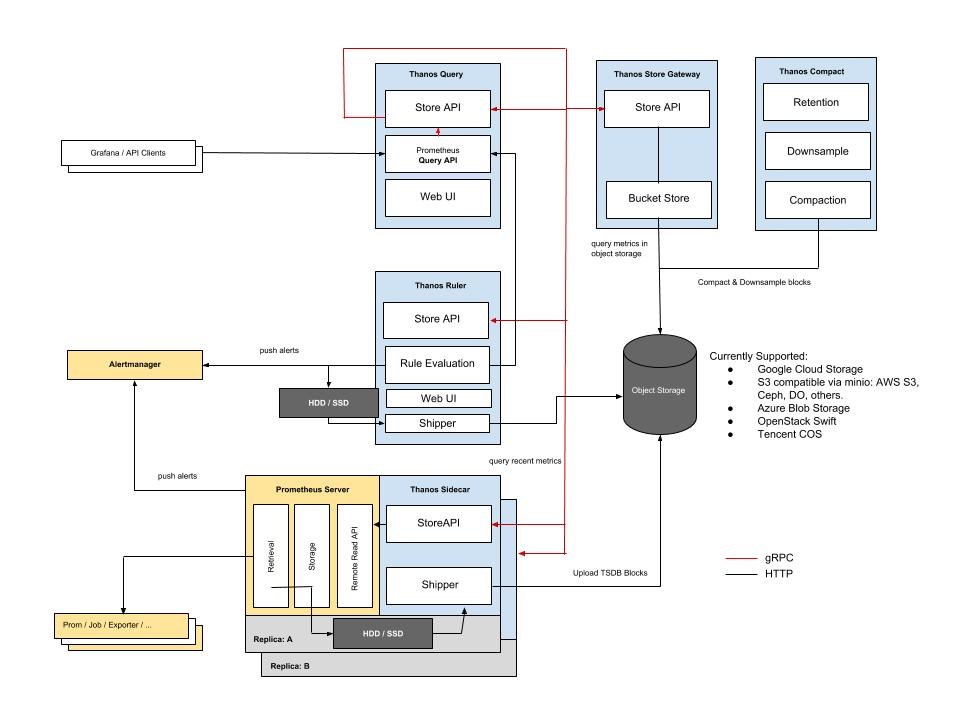
Thanos 主要由如下几个特定功能的组件组成:
- 边车组件(Sidecar):连接 Prometheus,并把 Prometheus 暴露给查询网关(Querier/Query),以供实时查询,并且可以上传 Prometheus 数据给云存储,以供长期保存
- 查询网关(Querier/Query):实现了 Prometheus API,与汇集底层组件(如边车组件 Sidecar,或是存储网关 Store Gateway)的数据
- 存储网关(Store Gateway):将云存储中的数据内容暴露出来
- 压缩器(Compactor):将云存储中的数据进行压缩和下采样
- 接收器(Receiver):从 Prometheus 的 remote-write WAL(Prometheus 远程预写式日志)获取数据,暴露出去或者上传到云存储
- 规则组件(Ruler):针对监控数据进行评估和报警
- Bucket:主要用于展示对象存储中历史数据的存储情况,查看每个指标源中数据块的压缩级别,解析度,存储时段和时间长度等信息。
工作流程
Thanos 是同时支持 Prometheus 读和写的远程存储方案,首先我们先看下指标写入的整个流程:
- 首先 Prometheus 从所采集服务的 metrics 接口抓取指标数据,同时根据自身所配置的
recording rules定期对抓取到的指标数据进行评估,将结果以 TSDB 格式分块存储到本地,每个数据块的存储时长为 2 小时,且默认禁用了压缩功能。 - 然后
sidecar嗅探到 Prometheus 的数据存储目录生成了新的只读数据块时,会将该数据块上传到对象存储桶中做为长期历史数据保存,在上传时会将数据块中的meta.json进行修改添加 thanos 相关的字段,如external_labels。 rule根据所配置的recording rules定期地向query发起查询获取评估所需的指标值,并将结果以 TSDB 格式分块存储到本地。每个数据块的存储时长为 2 小时,且默认禁用了压缩功能,每个数据块的meta.json也附带了 thanos 拓展的external_lables字段。当本地生成了新的只读数据块时,其自身会将该数据块上传到远端对象存储桶中做为长期历史数据保存。compact定期将对象存储中地数据块进行压缩和降准采样,进行压缩时数据块中的 truck 会进行合并,对应的meta.json中的 level 也会一同增长,每次压缩累加 1,初始值为 1。在进行降准采样时会创建新的数据块,根据采样步长从原有的数据块中抽取值存储到新的数据块中,在meta.json中记录resolution为采样步长。
读取指标的流程为:
- 首先客户端通过
query API向query发起查询,query将请求转换成StoreAPI发送到其他的query、sidecar、rule和store上。 sidecar接收到来自于query发起的查询请求后将其转换成query API请求,发送给其绑定的 Prometheus,由 Prometheus 从本地读取数据并响应,返回短期的本地采集和评估数据。rule接收到来自于query发起的查询请求后直接从本地读取数据并响应,返回短期的本地评估数据。store接收到来自于query发起的查询请求后首先从对象存储桶中遍历数据块的meta.json,根据其中记录的时间范围和标签先进行一次过滤。接下来从对象存储桶中读取数据块的index和chunks进行查询,部分查询频率较高的index会被缓存下来,下次查询使用到时可以直接读取。最终返回长期的历史采集和评估指标。
对于发送报警的流程如下所示:
- Prometheus 根据自身配置的
alerting规则定期地对自身采集的指标进行评估,当告警条件满足的情况下发起告警到 Alertmanager 上。 rule根据自身配置的alerting规则定期的向query发起查询请求获取评估所需的指标,当告警条件满足的情况下发起告警到 Alertmanager 上。- Alertmanager 接收到来自于 Prometheus 和
rule的告警消息后进行分组合并后发出告警通知。
特性
Thanos 相比起原生的 Prometheus 具有以下的一些优势:
- 统一查询入口——以
Querier作为统一的查询入口,其自身实现了 Prometheus 的查询接口和StoreAPI,可为其他的Querier提供查询服务,在查询时会从每个 Prometheus 实例的Sidecar和Store Gateway获取到指标数据。 - 查询去重——每个数据块都会带有特定的集群标签,
Querier在做查询时会去除集群标签,将指标名称和标签一致的序列根据时间排序合并。虽然指标数据来自不同的采集源,但是只会响应一份结果而不是多份重复的结果。 - 高空间利用率——每个 Prometheus 本身不存储长时间的数据,
Sidecar会将 Prometheus 已经持久化的数据块上传到对象存储中。Compactor会定时将远端对象存储中的长期数据进行压缩,并且根据采样时长做清理,节约存储空间。 - 高可用——
Querier是无状态服务,天生支持水平拓展和高可用。Store、Rule和Sidecar是有状态服务,在多副本部署的情况下也支持高可用,不过会产生数据冗余,需要牺牲存储空间。 - 存储长期数据——Prometheus 实例的
Sidecar会将本地数据上传到远端对象存储中作为长期数据 - 横向拓展——当 Prometheus 的指标采集压力过大时,可以创建新的 Prometheus 实例,将
scrape job拆分给多个 Prometheus,Querier从多个 Prometheus 查询汇聚结果,降低单个 Prometheus 的压力 - 跨集群查询——需要合并多个集群的查询结果时,仅需要在每个集群的
Querier之上再添加一层Querier即可,这样的层层嵌套,可以使得集群规模无限制拓展。
Sidecar 组件
首先将前面章节中的 Prometheus 相关的资源对象全部删除,然后我们需要在 Prometheus 中去自动发现集群的一些资源对象,所以依然需要对应的 RBAC 权限声明:(rbac.yaml)
apiVersion: v1
kind: ServiceAccount
metadata:
  name: prometheus
  namespace: kube-mon
---
apiVersion: rbac.authorization.k8s.io/v1
kind: ClusterRole
metadata:
  name: prometheus
rules:
  - apiGroups:
      - ""
    resources:
      - nodes
      - services
      - endpoints
      - pods
      - nodes/proxy
    verbs:
      - get
      - list
      - watch
  - apiGroups:
      - "extensions"
    resources:
      - ingresses
    verbs:
      - get
      - list
      - watch
  - apiGroups:
      - ""
    resources:
      - configmaps
      - nodes/metrics
    verbs:
      - get
  - nonResourceURLs:
      - /metrics
    verbs:
      - get
---
apiVersion: rbac.authorization.k8s.io/v1beta1
kind: ClusterRoleBinding
metadata:
  name: prometheus
roleRef:
  apiGroup: rbac.authorization.k8s.io
  kind: ClusterRole
  name: prometheus
subjects:
  - kind: ServiceAccount
    name: prometheus
    namespace: kube-mon
然后需要部署 Prometheus 的配置文件,下面的资源对象是创建 Prometheus 配置文件的模板,该模板将由 Thanos sidecar 组件进行读取,最终会通过该模板生成实际的配置文件,在同一个 Pod 中的 Prometheus 容器将读取最终的配置文件,在配置文件中添加 external_labels 标签是非常重要的,以便让 Queirer 可以基于这些标签对数据进行去重处理:(configmap.yaml)
apiVersion: v1
kind: ConfigMap
metadata:
  name: prometheus-config
  namespace: kube-mon
data:
  prometheus.yaml.tmpl: | # 注意这里的名称是 prometheus.yaml.tmpl
    global:
      scrape_interval: 15s
      scrape_timeout: 15s
      external_labels:
        cluster: ydzs-test
        replica: $(POD_NAME)  # 每个 Prometheus 有一个唯一的标签

    rule_files:  # 报警规则文件配置
    - /etc/prometheus/rules/*rules.yaml

    alerting:
      alert_relabel_configs:  # 我们希望告警从不同的副本中也是去重的
      - regex: replica
        action: labeldrop
      alertmanagers:
      - scheme: http
        path_prefix: /
        static_configs:
        - targets: ['alertmanager:9093']

    scrape_configs:
    ......  # 其他抓取任务配置和前面章节中的配置保持一致即可
上面配置了报警规则文件,由于这里配置文件太大了,所以为了更加清晰,我们将报警规则文件拆分到另外的 ConfigMap 对象中来,下面我们配置了两个报警规则:(rules-configmap.yaml)
apiVersion: v1
kind: ConfigMap
metadata:
  name: prometheus-rules
  namespace: kube-mon
data:
  alert-rules.yaml: |-
    groups:
      - name: Deployment
        rules:
        - alert: Deployment at 0 Replicas
          annotations:
            summary: Deployment {{$labels.deployment}} in {{$labels.exported_namespace}} is currently having no pods running
          expr: |
            sum(kube_deployment_status_replicas) by (deployment,exported_namespace)  < 1
          for: 1m
          labels:
            team: node
      - name: Pods
        rules:
        - alert: Container restarted
          annotations:
            summary: Container named {{$labels.container}} in {{$labels.pod}} in {{$labels.exported_namespace}} was restarted
          expr: |
            sum(increase(kube_pod_container_status_restarts_total[1m])) by (pod,exported_namespace,container) > 0
          for: 0m
          labels:
            team: node
Thanos 通过 Sidecar 和现有的 Prometheus 进行集成,将 Prometheus 的数据备份到对象存储中,所以首先我们需要将 Prometheus 和 Sidecar 部署在同一个 Pod 中,另外 Prometheus 中一定要开启下面两个参数:
--web.enable-admin-api允许 Thanos 的 Sidecar 从 Prometheus 获取元数据。--web.enable-lifecycle允许 Thanos 的 Sidecar 重新加载 Promehtues 的配置和规则文件。
由于 Prometheus 默认每2h生成一个 TSDB 数据块,所以仍然并不意味着 Prometheus 可以是完全无状态的,因为如果它崩溃并重新启动,我们将丢失〜2 个小时的指标,因此强烈建议依然对 Prometheus 做数据持久化,所以我们这里使用了 StatefulSet 来管理这个应用,添加 volumeClaimTemplates 来声明了数据持久化的 PVC 模板:(sidecar.yaml)
apiVersion: apps/v1
kind: StatefulSet
metadata:
  name: prometheus
  namespace: kube-mon
  labels:
    app: prometheus
spec:
  serviceName: "prometheus"
  replicas: 2
  selector:
    matchLabels:
      app: prometheus
      thanos-store-api: "true"
  template:
    metadata:
      labels:
        app: prometheus
        thanos-store-api: "true"
    spec:
      serviceAccountName: prometheus
      volumes:
        - name: prometheus-config
          configMap:
            name: prometheus-config
        - name: prometheus-rules
          configMap:
            name: prometheus-rules
        - name: prometheus-config-shared
          emptyDir: {}
      containers:
        - name: prometheus
          image: prom/prometheus:v2.14.0
          imagePullPolicy: IfNotPresent
          args:
            - "--config.file=/etc/prometheus-shared/prometheus.yaml"
            - "--storage.tsdb.path=/prometheus"
            - "--storage.tsdb.retention.time=6h"
            - "--storage.tsdb.no-lockfile"
            - "--storage.tsdb.min-block-duration=2h" # Thanos处理数据压缩
            - "--storage.tsdb.max-block-duration=2h"
            - "--web.enable-admin-api" # 通过一些命令去管理数据
            - "--web.enable-lifecycle" # 支持热更新  localhost:9090/-/reload 加载
          ports:
            - name: http
              containerPort: 9090
          resources:
            requests:
              memory: "2Gi"
              cpu: "1"
            limits:
              memory: "2Gi"
              cpu: "1"
          volumeMounts:
            - name: prometheus-config-shared
              mountPath: /etc/prometheus-shared/
            - name: prometheus-rules
              mountPath: /etc/prometheus/rules
            - name: data
              mountPath: "/prometheus"
        - name: thanos
          image: thanosio/thanos:v0.18.0
          imagePullPolicy: IfNotPresent
          args:
            - sidecar
            - --log.level=debug
            - --tsdb.path=/prometheus
            - --prometheus.url=http://localhost:9090
            - --reloader.config-file=/etc/prometheus/prometheus.yaml.tmpl
            - --reloader.config-envsubst-file=/etc/prometheus-shared/prometheus.yaml
            - --reloader.rule-dir=/etc/prometheus/rules/
          ports:
            - name: http-sidecar
              containerPort: 10902
            - name: grpc
              containerPort: 10901
          env:
            - name: POD_NAME
              valueFrom:
                fieldRef:
                  fieldPath: metadata.name
          resources:
            requests:
              memory: "2Gi"
              cpu: "1"
            limits:
              memory: "2Gi"
              cpu: "1"
          volumeMounts:
            - name: prometheus-config-shared
              mountPath: /etc/prometheus-shared/
            - name: prometheus-config
              mountPath: /etc/prometheus
            - name: prometheus-rules
              mountPath: /etc/prometheus/rules
            - name: data
              mountPath: "/prometheus"
  volumeClaimTemplates: # 由于prometheus每2h生成一个TSDB数据块,所以还是需要保存本地的数据
    - metadata:
        name: data
        labels:
          app: prometheus
      spec:
        storageClassName: openebs-jiva-default
        accessModes:
          - ReadWriteOnce
        resources:
          requests:
            storage: 2Gi
由于 Prometheus 和 Thanos 的 Sidecar 在同一个 Pod 中了,所以我们完全可以用 localhost 就可以访问到了,然后将数据目录做了声明挂载,所以同样可以在两个容器中共享数据目录了,一定要注意几个配置文件的挂载方式。此外在上面的配置文件中我们通过 POD_NAME 这个环境变量作为 external 标签附加到了 Prometheus 实例上,这里我们通过 Downward API 去设置该环境变量。
由于现在使用的是 StatefulSet 控制器,所以需要创建一个 Headless Service,而且后面的 Thanos Query 还将使用该无头服务来查询所有 Prometheus 实例中的数据,当然我们也可以为每一个 Prometheus 实例去创建一个 Service 对象便于调试,当然这个不是必须的:(headless.yaml)
# 该服务为 querier 创建 srv 记录,以便查找 store-api 的信息
apiVersion: v1
kind: Service
metadata:
  name: thanos-store-gateway
  namespace: kube-mon
spec:
  type: ClusterIP
  clusterIP: None
  ports:
    - name: grpc
      port: 10901
      targetPort: grpc
  selector:
    thanos-store-api: "true"
然后我们就可以使用上面的这些资源对象来创建带有 Thanos Sidecar 容器的高可用 Prometheus 应用了:
$ kubectl apply -f rbac.yaml
$ kubectl apply -f configmap.yaml
$ kubectl apply -f rules-configmap.yaml
$ kubectl apply -f headless.yaml
$ kubectl apply -f sidecar.yaml
$ kubectl get pods -n kube-mon -l app=prometheus
NAME           READY   STATUS    RESTARTS   AGE
prometheus-0   2/2     Running   0          86s
prometheus-1   2/2     Running   0          74s
Querier 组件
现在我们就创建成功了两个 Prometheus 实例,但是我们真正去使用的时候并不是像上面提到的在前面加一个负载均衡器去查询监控数据,而是使用 Thanos 的 Querier 组件来提供一个全局的统一查询入口。对于 Quierier 最重要的就是要配置上 Thanos 的 Sidecar 地址,我们这里完全可以直接使用 Headless Service 去自动发现:(querier.yaml)
apiVersion: apps/v1
kind: Deployment
metadata:
  name: thanos-querier
  namespace: kube-mon
  labels:
    app: thanos-querier
spec:
  selector:
    matchLabels:
      app: thanos-querier
  template:
    metadata:
      labels:
        app: thanos-querier
    spec:
      containers:
        - name: thanos
          image: thanosio/thanos:v0.18.0
          args:
            - query
            - --log.level=debug
            - --query.replica-label=replica
            # Discover local store APIs using DNS SRV.
            - --store=dnssrv+thanos-store-gateway:10901
          ports:
            - name: http
              containerPort: 10902
            - name: grpc
              containerPort: 10901
          resources:
            requests:
              memory: "2Gi"
              cpu: "1"
            limits:
              memory: "2Gi"
              cpu: "1"
          livenessProbe:
            httpGet:
              path: /-/healthy
              port: http
            initialDelaySeconds: 10
          readinessProbe:
            httpGet:
              path: /-/healthy
              port: http
            initialDelaySeconds: 15
---
apiVersion: v1
kind: Service
metadata:
  name: thanos-querier
  namespace: kube-mon
  labels:
    app: thanos-querier
spec:
  ports:
    - port: 9090
      protocol: TCP
      targetPort: http
      name: http
  selector:
    app: thanos-querier
  type: NodePort
容器中的参数 --store=dnssrv+thanos-store-gateway:10901 可以帮助自动发现可以查询指标数据的所有组件;然后创建一个 thanos-querier 的 Serivce 对象可以来提供一个运行 PromQL 的 web 页面,也提供了一个是否对不同集群数据进行去重的入口。直接创建上面的对象:
$ kubectl apply -f querier.yaml
$ kubectl get pods -n kube-mon -l app=thanos-querier
NAME                             READY   STATUS    RESTARTS   AGE
thanos-querier-cf566866b-r4jcj   1/1     Running   0          3m26s
$ kubectl get svc -n kube-mon -l app=thanos-querier
NAME             TYPE       CLUSTER-IP      EXTERNAL-IP   PORT(S)          AGE
thanos-querier   NodePort   10.108.199.11   <none>        9090:31854/TCP   3m30s
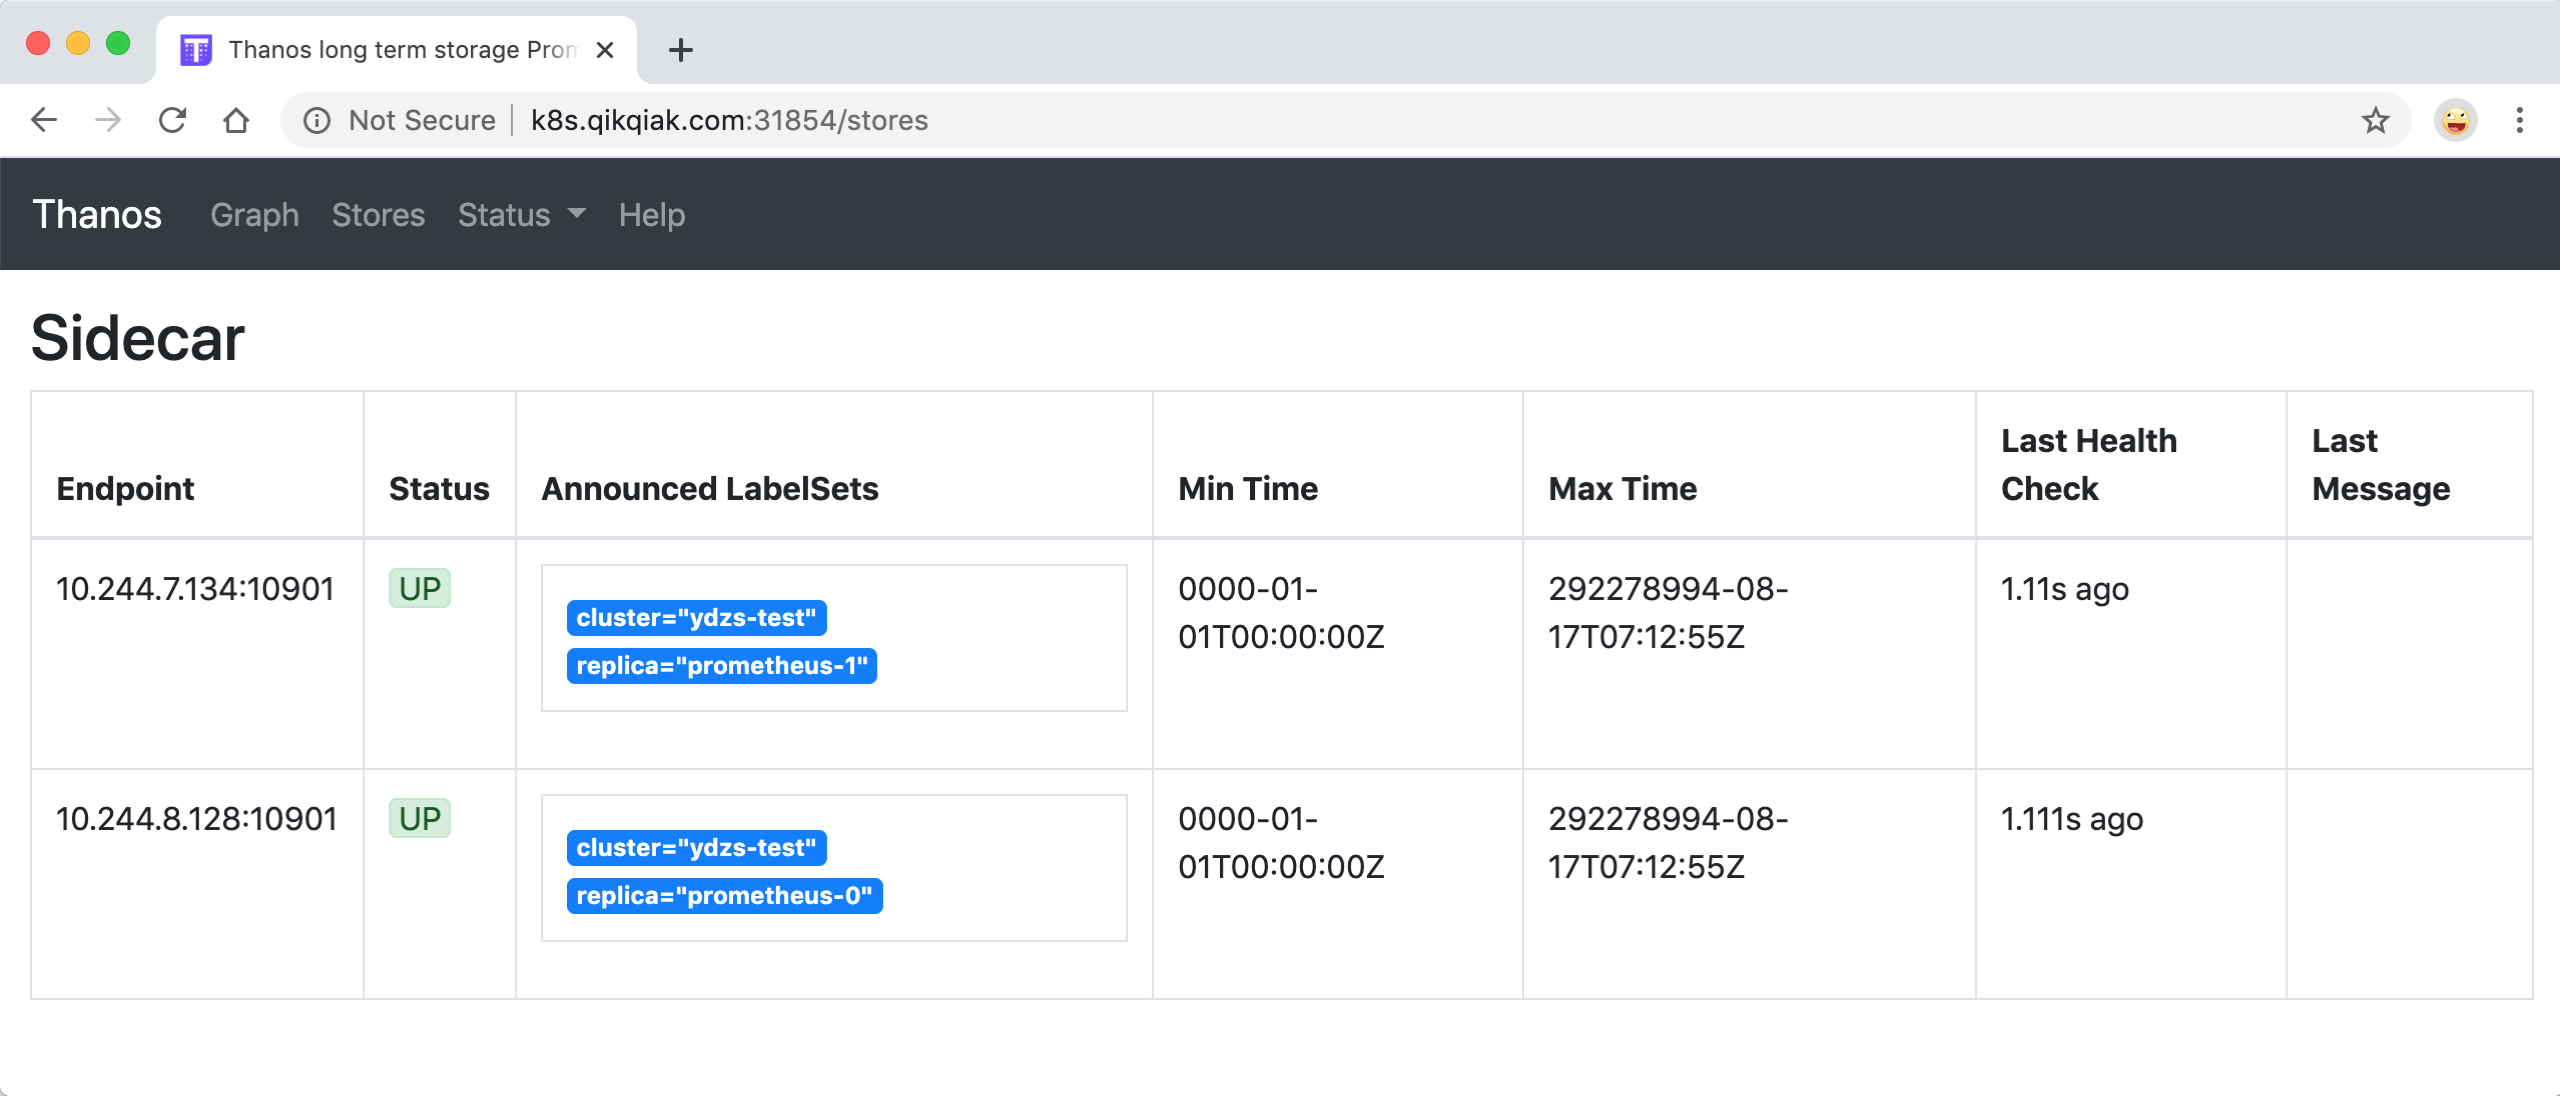
部署完成后我们就可以通过 http://<任意节点IP>:31854 去访问 Querier 了,在 Stores 页面下面就会显示通过服务发现获取到的 Sidecar 信息:
在 Graph 页面下同样可以去使用 PromQL 语句来查询监控信息,这个页面和 Prometheus 原生的页面几乎是一致的,比如我们查询 master 节点的节点信息:
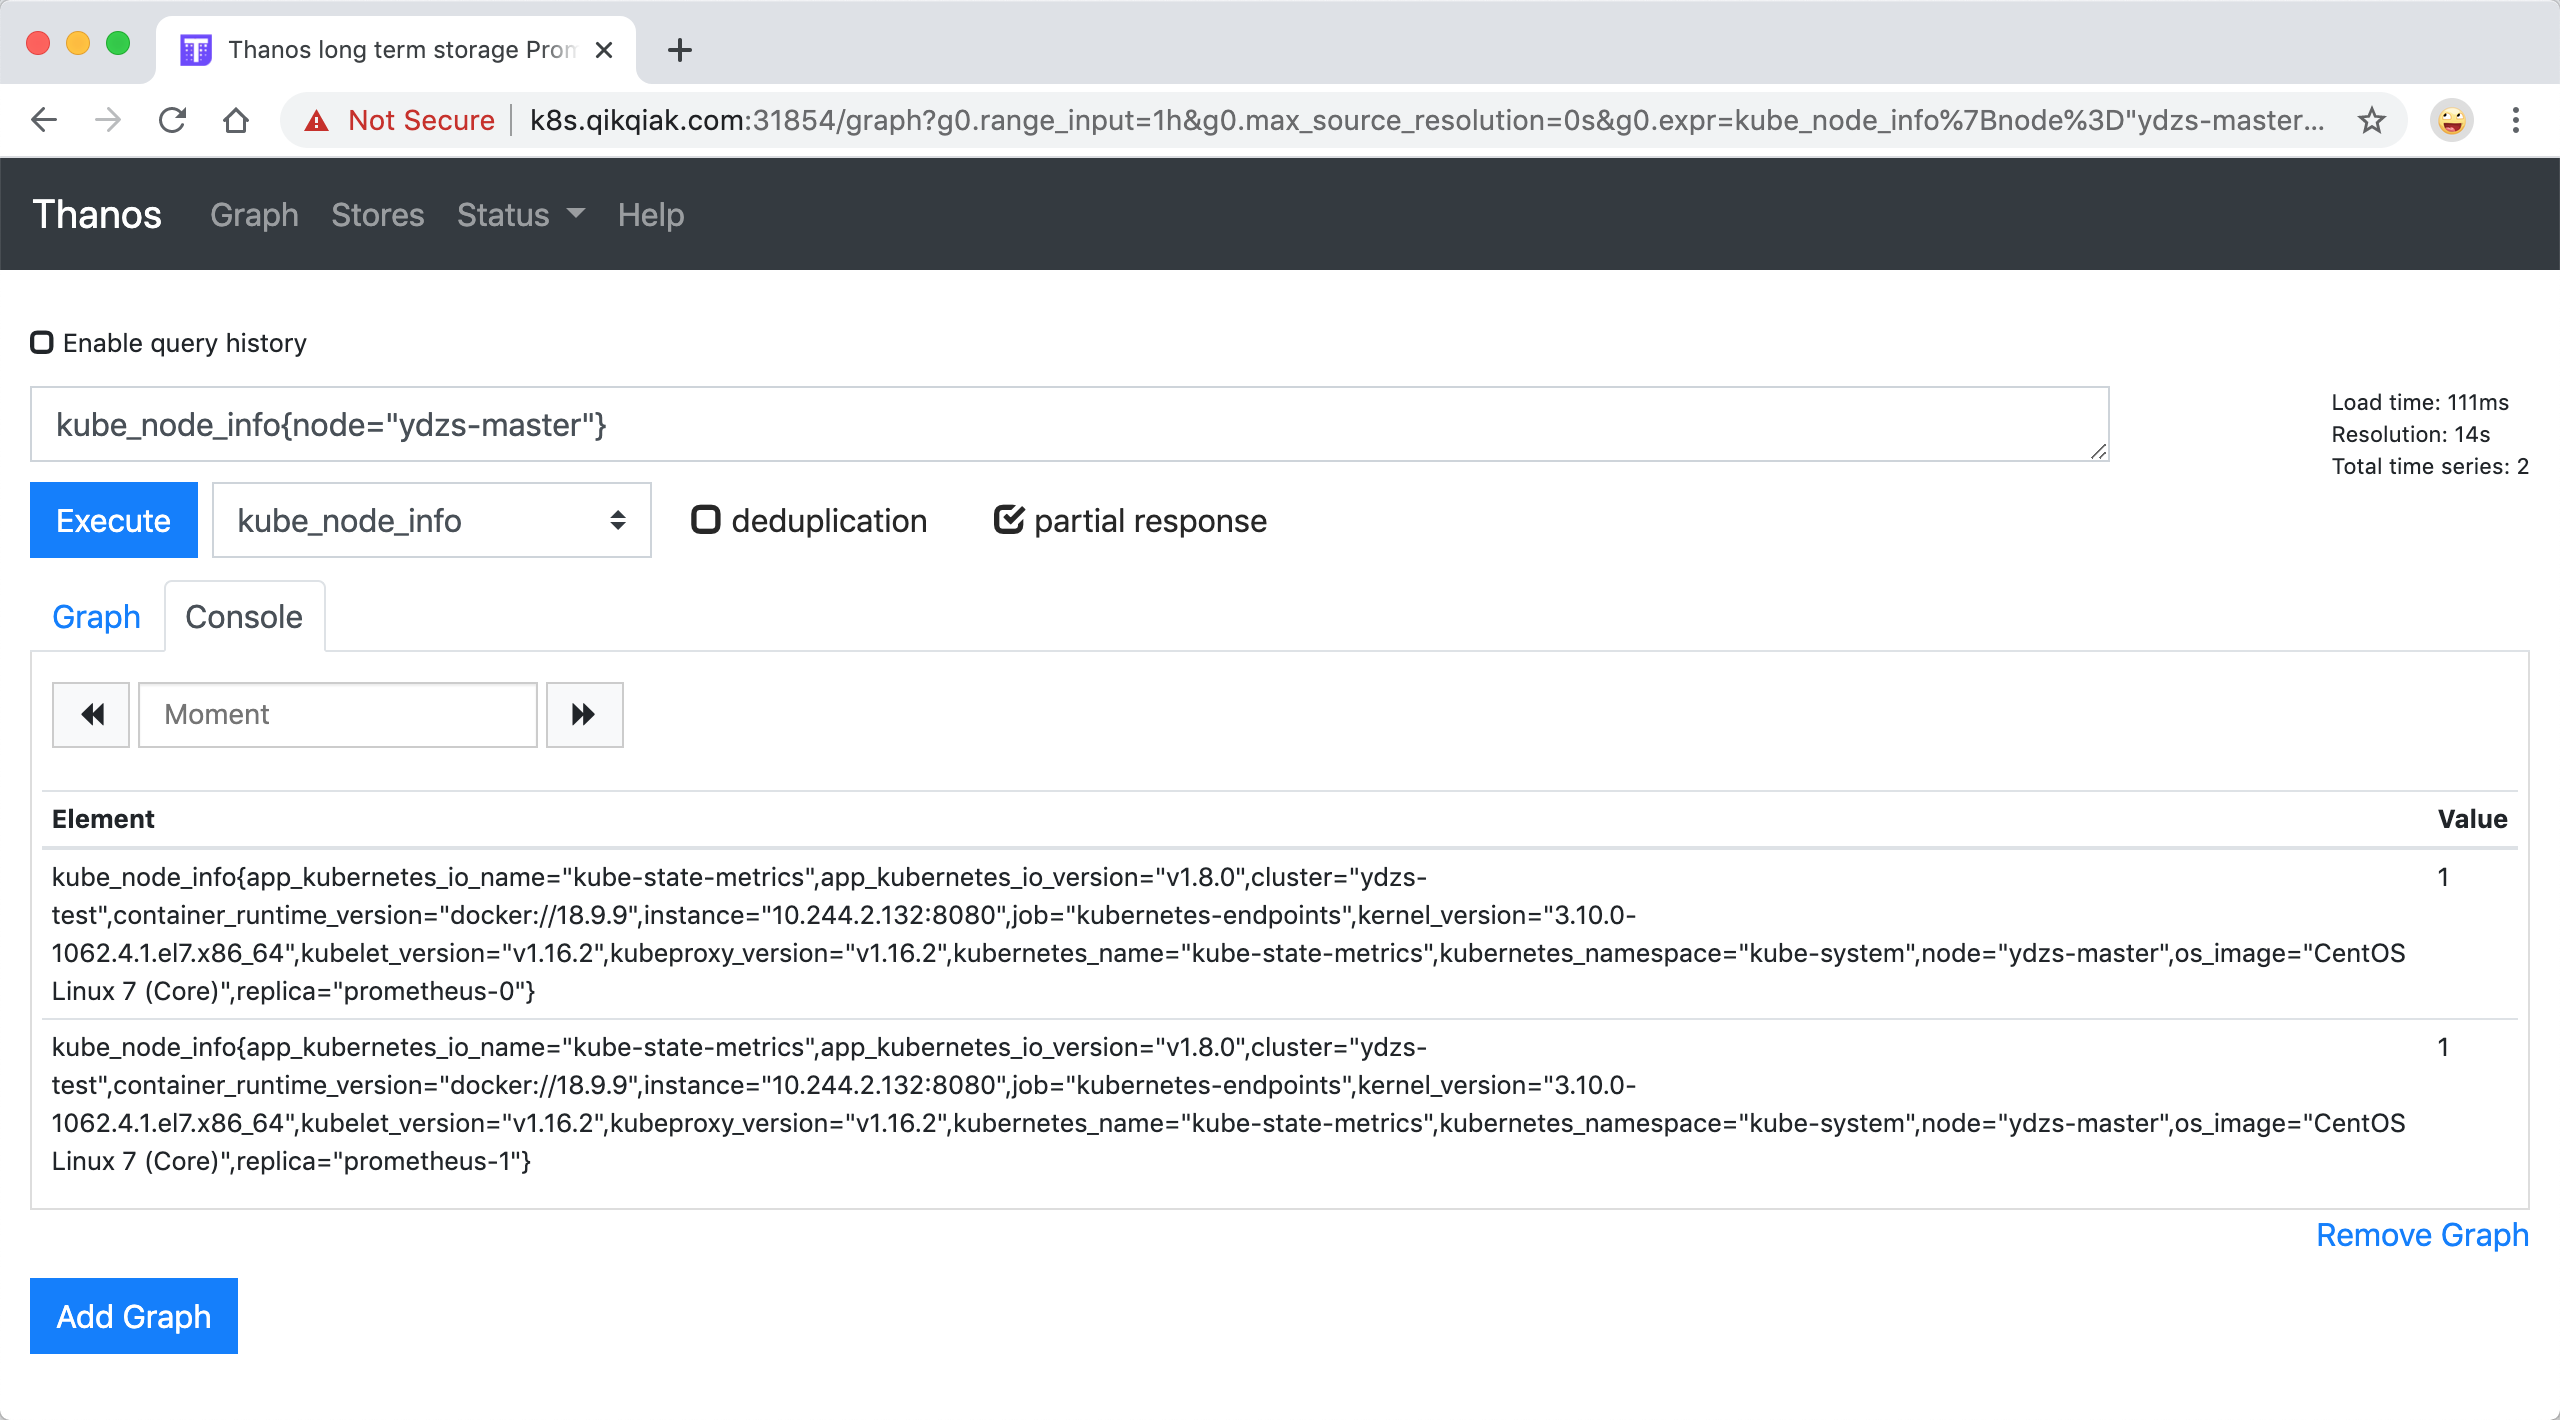
这里我没有勾上 deduplication,所以 Thanos 不会帮我合并数据,所以能够看到 prometheus-0 和 prometheus-1 两条数据,因为我们有两个副本去抓取监控数据。
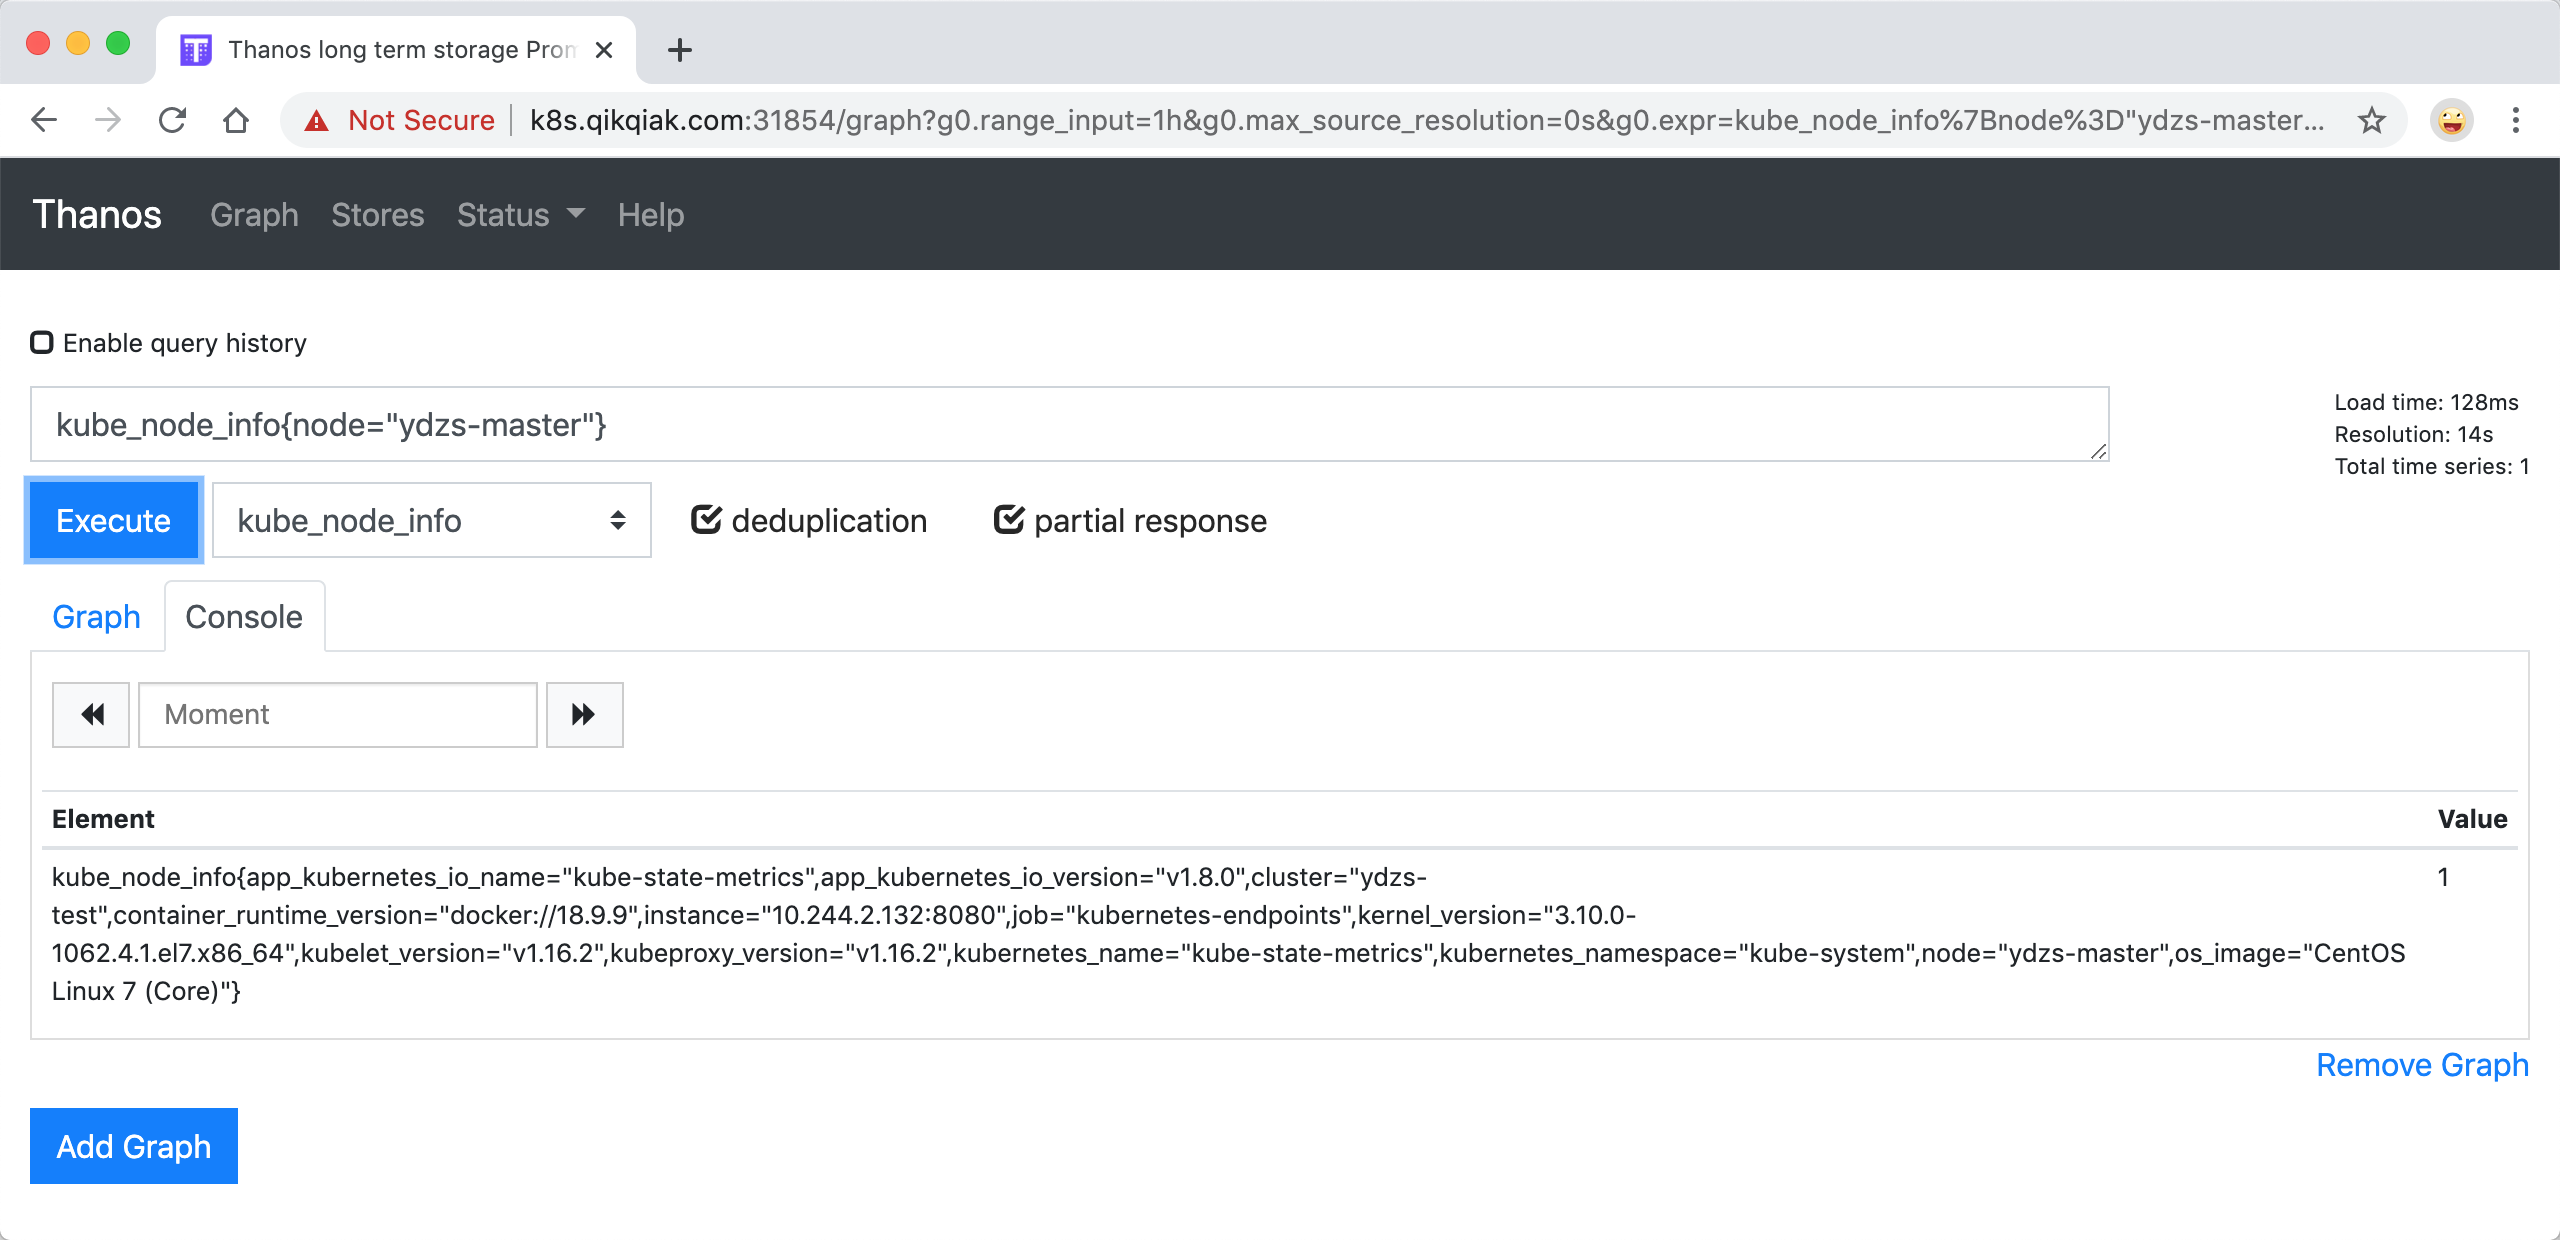
如果将 deduplication 选中,结果会根据 replica 这个标签进行合并,如果两个副本都有对应的数据,Querier 会取 timestamp 更小的结果:
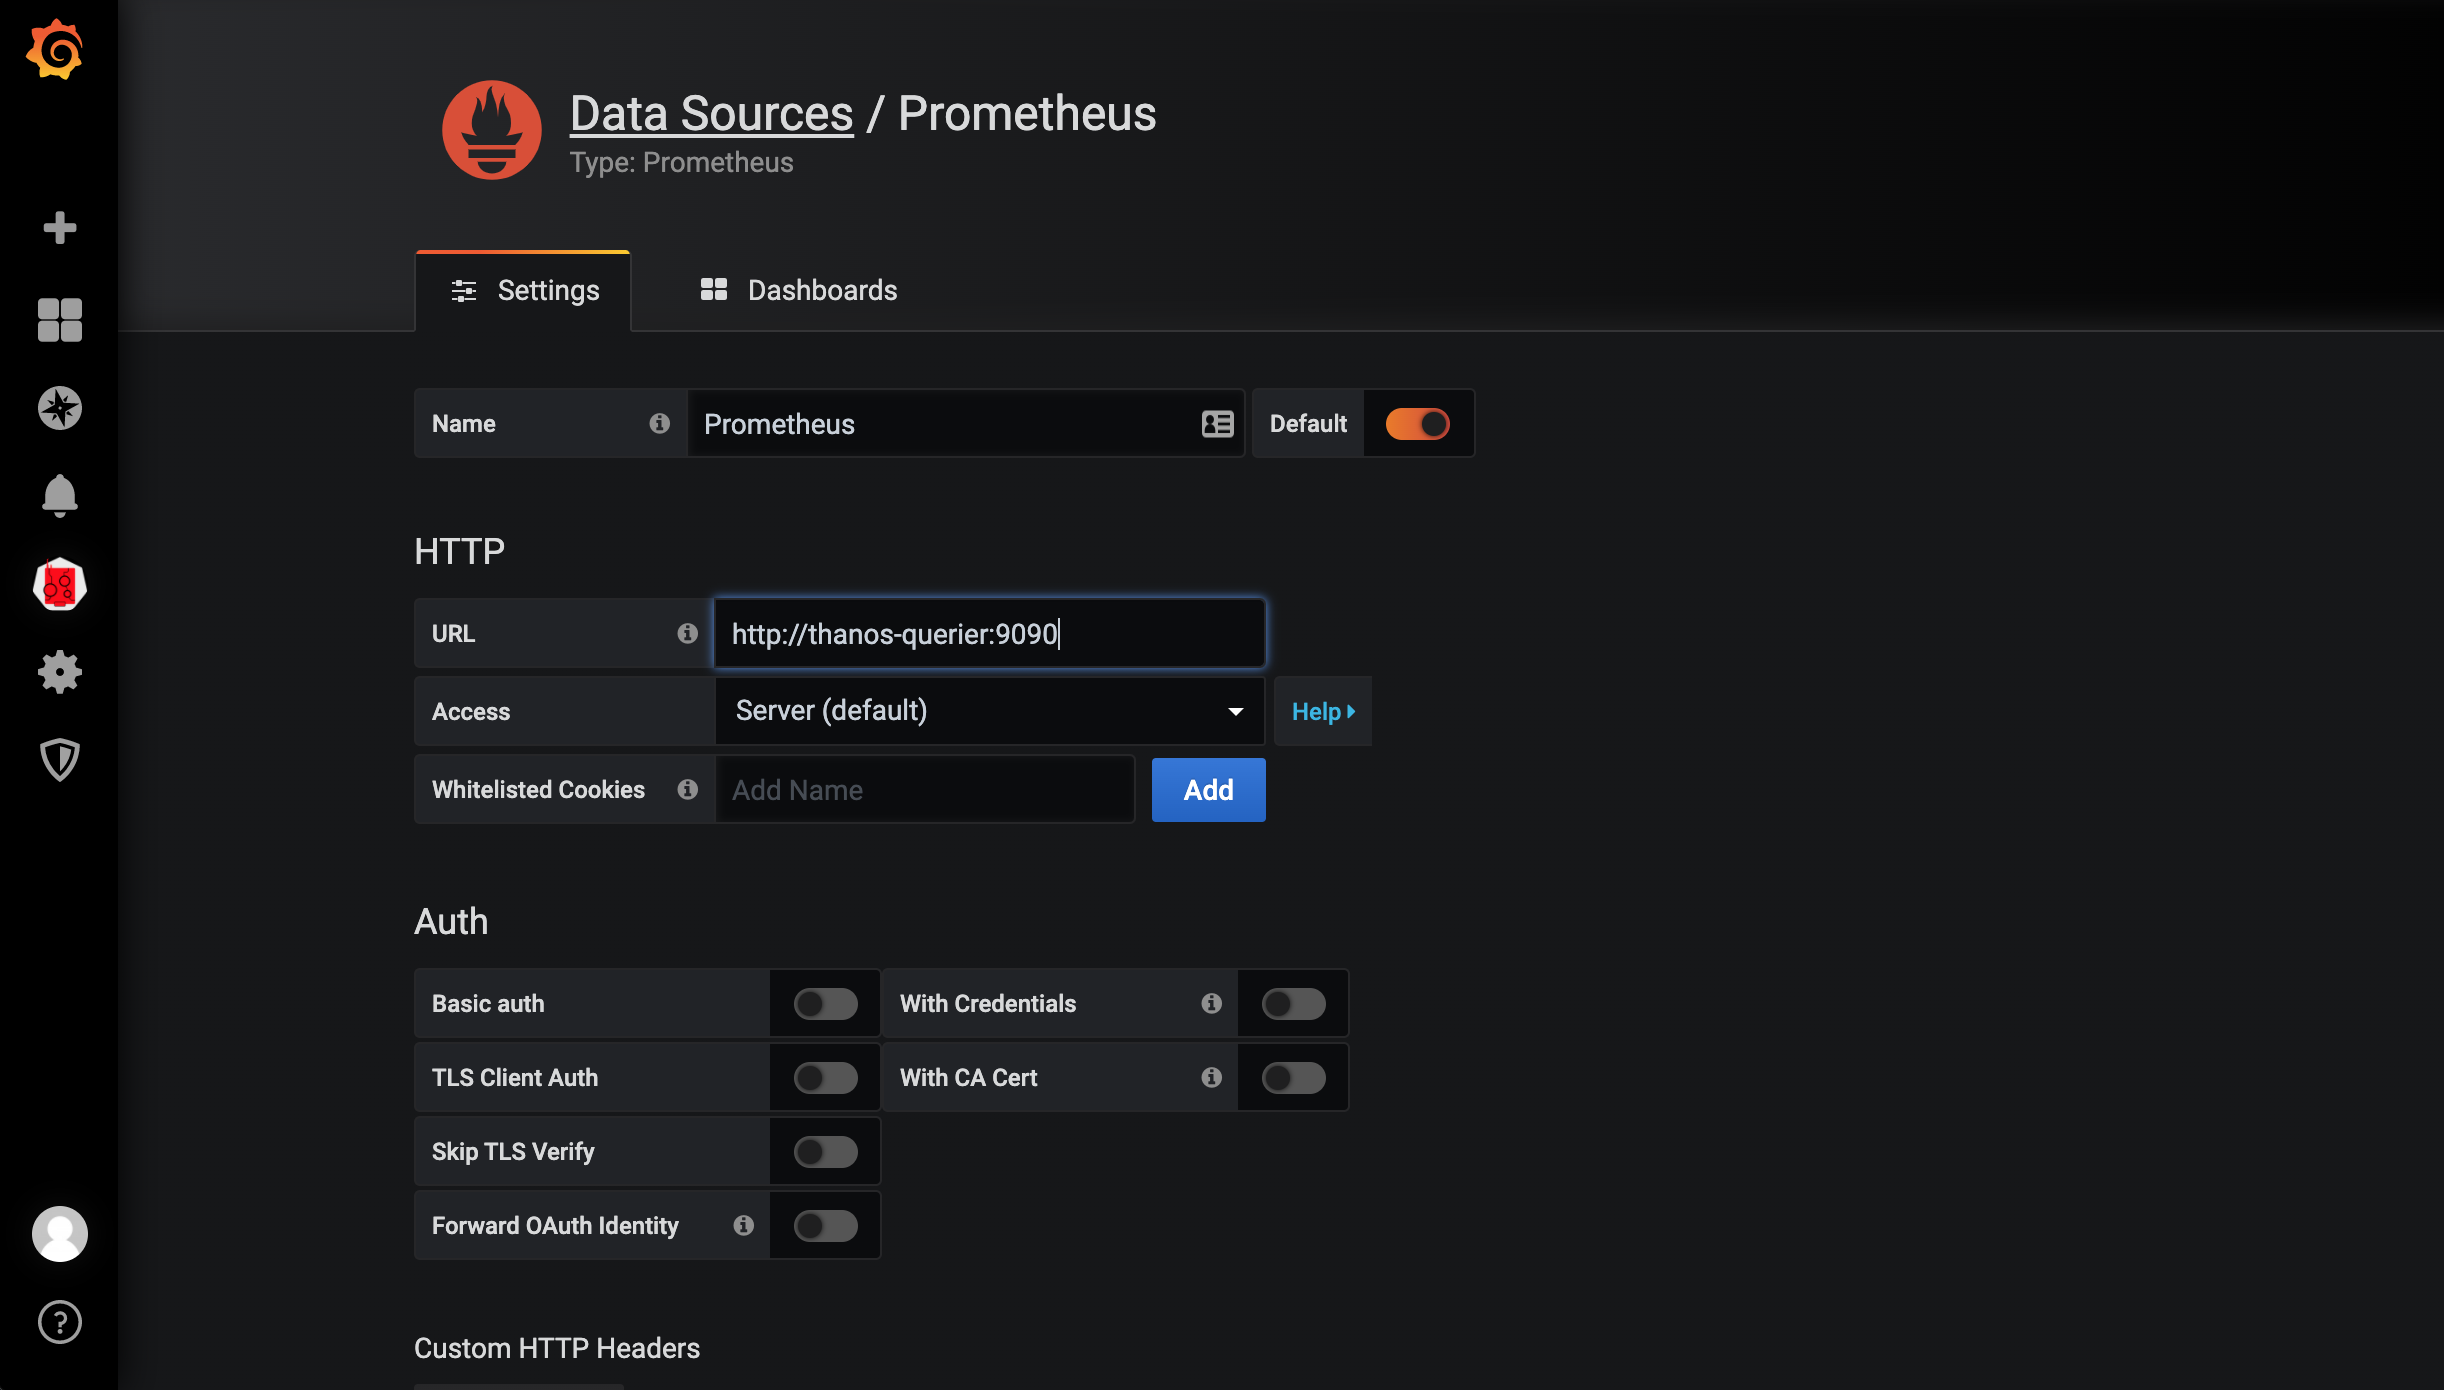
当然这个时候我们在前面章节中 Grafana 里面配置的 Prometheus 的数据源也就失效了,因为现在监控数据的来源是 Thanos Querier,所以我们需要重新配置 Prometheus 的数据源地址为 http://thanos-querier:9090:
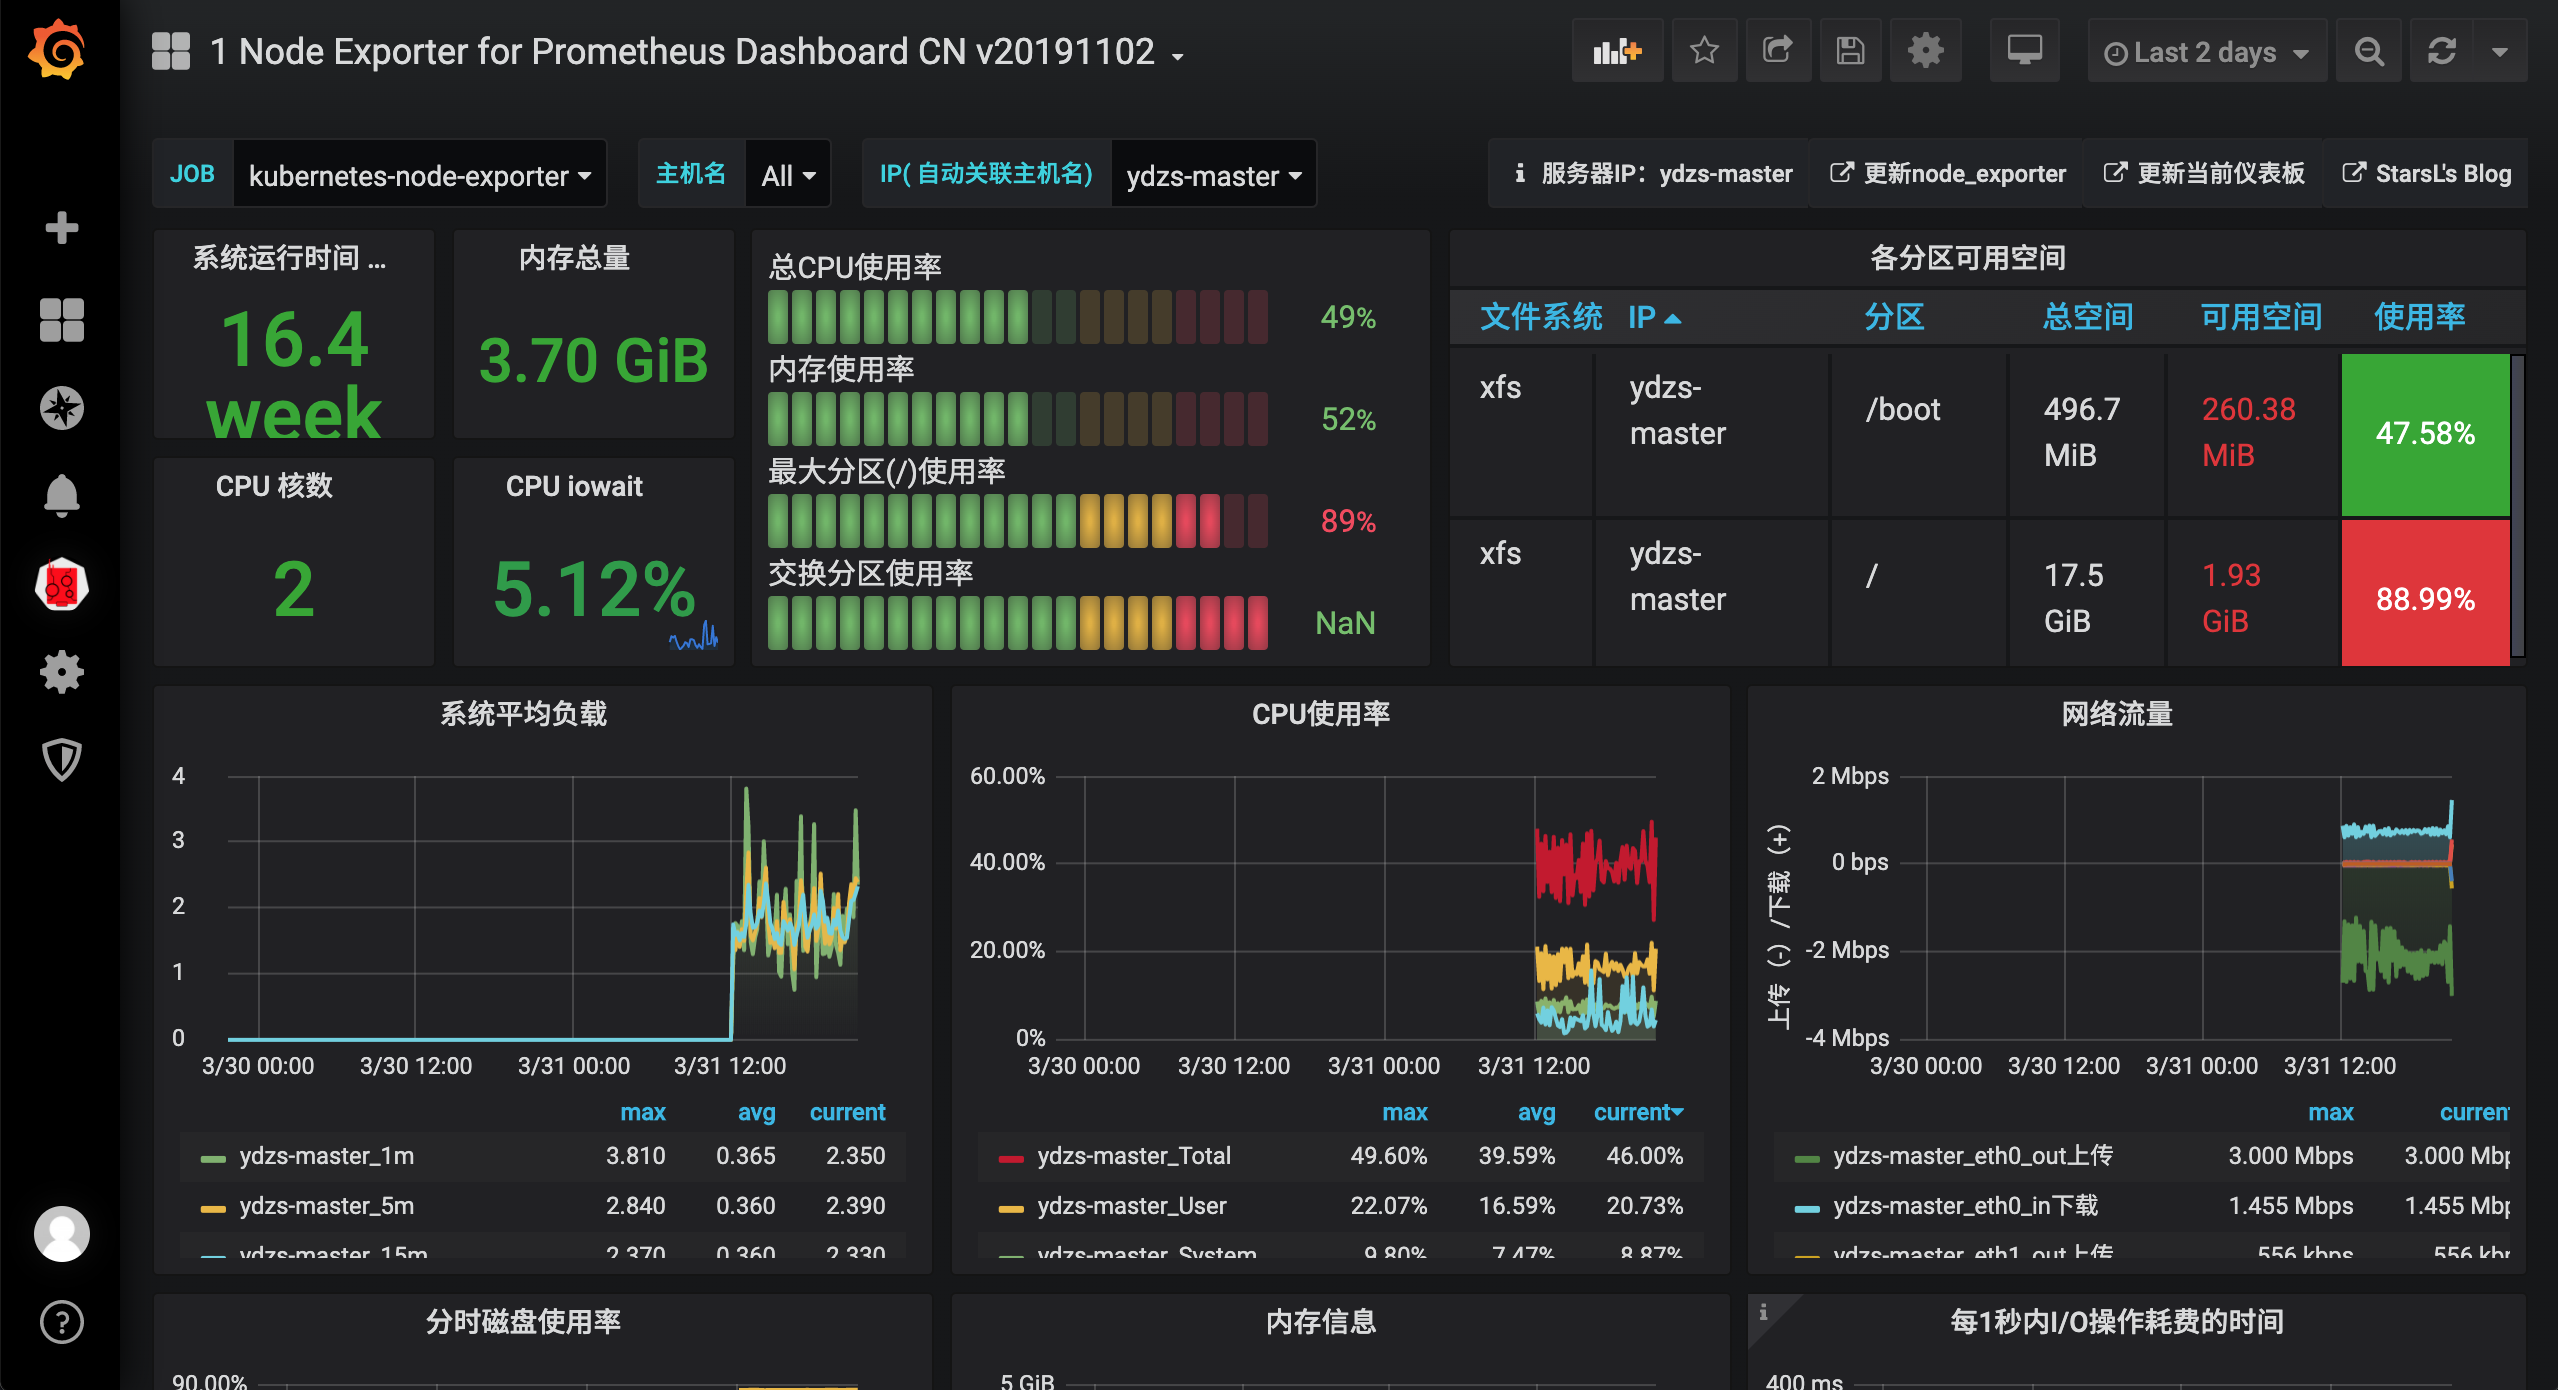
之前的监控图表也可以正常显示了:
Ruler 组件
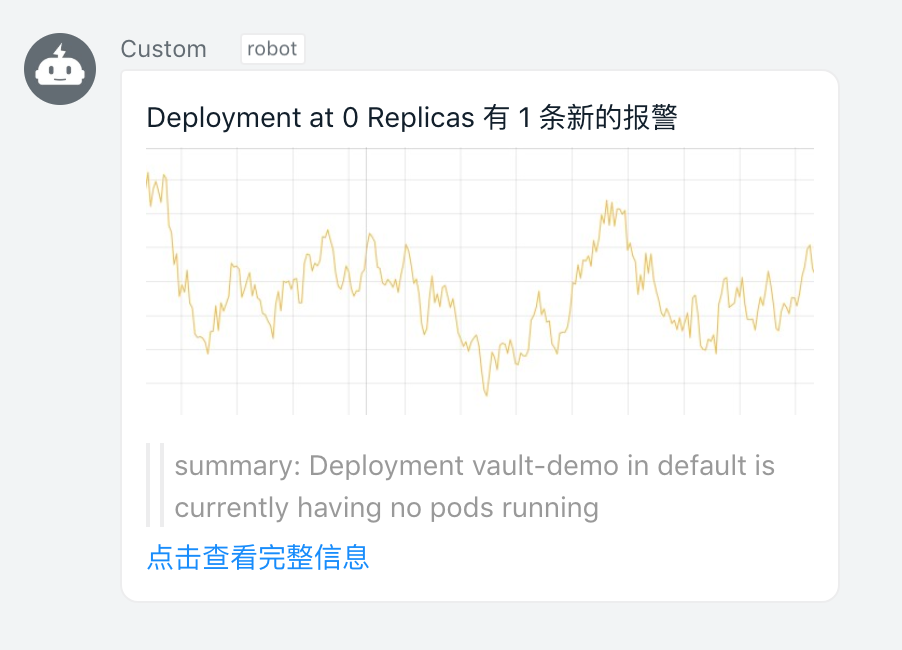
现在我们可以测试下 Prometheus 里面配置的监控报警规则是否生效,比如对于 Deployment at 0 Replicas 这个报警规则,当集群中有 Deployment 的副本数变成 0 过后就会触发报警:
$ kubectl get deploy
NAME                     READY   UP-TO-DATE   AVAILABLE   AGE
vault-demo               1/1     1            1           41d
我们可以手动将某个 Deployment 的副本数缩减为 0:
$ kubectl scale --replicas=0 deployment/vault-demo
deployment.apps/vault-demo scaled
$ kubectl get deploy
NAME                     READY   UP-TO-DATE   AVAILABLE   AGE
vault-demo               0/0     0            0           41d
这个时候 Alertmanager 同样也会根据外部的 replica 标签对告警进行去重,上面的报警规则中我们添加了 team=node 这样的标签,所以会通过前面章节中的 webhook 接收器发送给钉钉进行告警:
当然除了直接使用 Prometheus 做报警和记录规则之外,同样我们也可以使用 Thanos 的 Ruler 组件,该组件本身不会抓取 metrics 接口数据,而是通过 query API 从 query 组件定期地获取指标数据,如果配置了多个 query 地址,则会采用轮询方式获取。
Ruler 组件获取评估数据的路径为 rule --> query --> sidecar --> prometheus 需要经过一整个查询链条,这也提升了发生故障的风险,且评估原本就可以在 Prometheus 中进行,所以非必要的情况下还是更加推荐使用 Prometheus 来直接做 alerting 和 recording 评估,对于 Ruler 组件的具体使用方式感兴趣的也可以直接查看官方文档 https://thanos.io/components/rule.md/ 了解更多细节。
Store 组件
上面我们安装了 Thanos 的 Sidecar 和 Querier 组件,已经可以做到 Prometheus 的高可用,通过 Querier 提供一个统一的入口来查询监控数据,而且还可以对监控数据自动去重,但是还有一个非常重要的地方是还没有配置对象存储,如果想要查看历史监控数据就不行了,这个时候我们就需要去配置 Thanos Store 组件,将历史监控指标存储在对象存储中去。
目前 Thanos 支持的对象存储有:
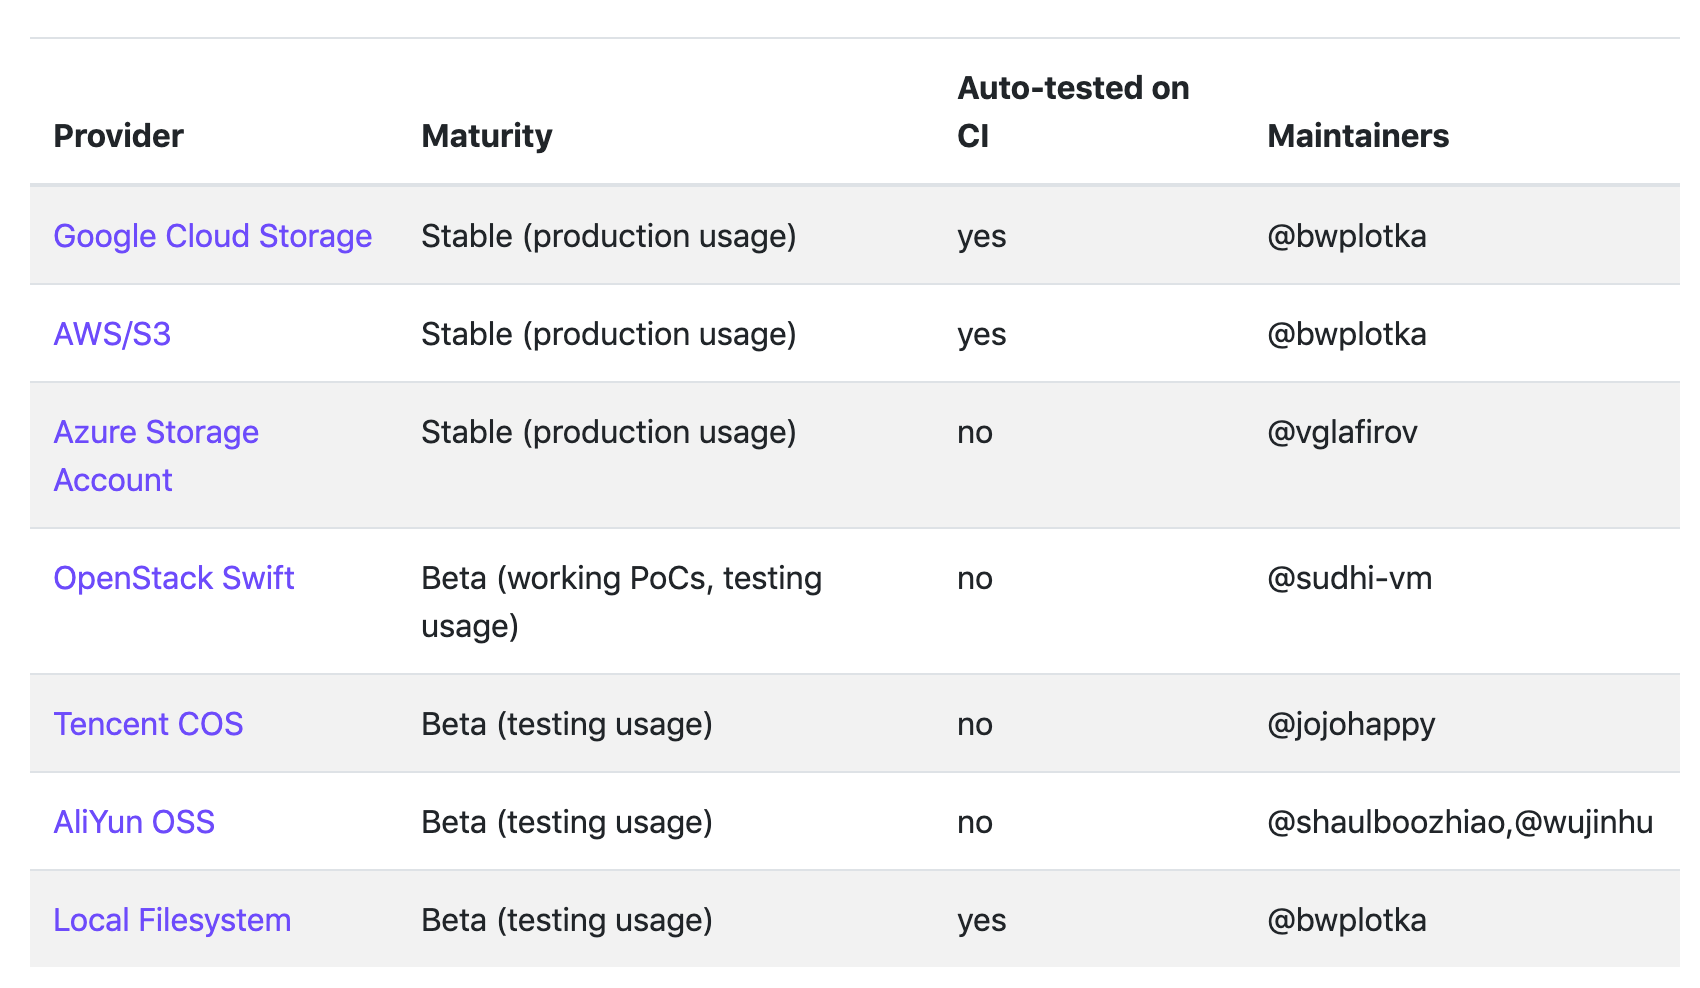
要在生产环境使用最好使用 Stable 状态的,比如 S3 或者兼容 S3 的服务,比如 Ceph、Minio 等等。
对于国内用户当然最方便的还是直接使用阿里云 OSS 或者腾讯云 COS 这样的服务,很多时候可能我们的服务并不是跑在公有云上面的,所以这里我们用 Minio 来部署一个兼容 S3 协议的对象存储服务。
安装 Minio
MinIO 是一个基于 Apache License v2.0 开源协议的对象存储服务。它兼容亚马逊 S3 云存储服务接口,非常适合于存储大容量非结构化的数据,例如图片、视频、日志文件、备份数据和容器/虚拟机镜像等,而一个对象文件可以是任意大小,从几 kb 到最大 5T 不等。
要安装 Minio 非常容易的,同样我们这里将 Minio 安装到 Kubernetes 集群中,可以直接参考官方文档 使用 Kubernetes 部署 MinIO,在 Kubernetes 集群下面可以部署独立、分布式或共享几种模式,可以根据实际情况部署,我们这里为了简单直接部署独立模式。
为了方便管理,将所有的资源对象都部署在一个名为 minio 的命名空间中,如果没有的话需要手动创建。直接使用 Deployment 来管理 Minio 的服务:(minio-deploy.yaml)
apiVersion: apps/v1
kind: Deployment
metadata:
  name: minio
spec:
  selector:
    matchLabels:
      app: minio
  strategy:
    type: Recreate
  template:
    metadata:
      labels:
        app: minio
    spec:
      volumes:
        - name: data
          persistentVolumeClaim:
            claimName: minio-pvc
      containers:
        - name: minio
          volumeMounts:
            - name: data
              mountPath: "/data"
          image: minio/minio:latest
          args:
            - server
            - /data
          env:
            - name: MINIO_ACCESS_KEY
              value: "minio"
            - name: MINIO_SECRET_KEY
              value: "minio123"
          ports:
            - containerPort: 9000
          readinessProbe:
            httpGet:
              path: /minio/health/ready
              port: 9000
            initialDelaySeconds: 90
            periodSeconds: 10
          livenessProbe:
            httpGet:
              path: /minio/health/live
              port: 9000
            initialDelaySeconds: 30
            periodSeconds: 10
通过一个名为 minio-pvc 的 PVC 对象将数据持久化,当然我们可以使用静态的 PV 来提供存储,这里我们直接使用前面的 OpenEBS 的 LocalPV 来提供存储服务,使用 openebs-jiva-default 这个 StorageClass 对象来提供动态 PV,对于这里不熟悉的可以查看前面我们讲解的存储章节内容:(minio-pvc.yaml)
apiVersion: v1
kind: PersistentVolumeClaim
metadata:
  name: minio-pvc
spec:
  accessModes:
    - ReadWriteOnce
  resources:
    requests:
      storage: 10G
  storageClassName: openebs-jiva-default
最后我们可以通过 Service 和 Ingress 对象将 Minio 暴露给外部用户使用:(minio-ingress.yaml)
apiVersion: v1
kind: Service
metadata:
  name: minio
spec:
  ports:
    - port: 9000
      targetPort: 9000
      protocol: TCP
  selector:
    app: minio
---
apiVersion: traefik.containo.us/v1alpha1
kind: Middleware
metadata:
  name: redirect-https
spec:
  redirectScheme:
    scheme: https
---
apiVersion: traefik.containo.us/v1alpha1
kind: IngressRoute
metadata:
  name: minio
spec:
  entryPoints:
    - web
  routes:
    - kind: Rule
      match: Host(`minio.qikqiak.com`)
      services:
        - kind: Service
          name: minio
          port: 9000
      middlewares:
        - name: redirect-https
---
apiVersion: traefik.containo.us/v1alpha1
kind: IngressRoute
metadata:
  name: minio-https
spec:
  entryPoints:
    - websecure
  routes:
    - kind: Rule
      match: Host(`minio.qikqiak.com`)
      services:
        - kind: Service
          name: minio
          port: 9000
  tls:
    certResolver: ali
    domains:
      - main: "*.qikqiak.com"
这里我们使用的是 Traefik2.X 版本的 Ingress 控制器,使用 IngressRoute 这个资源对象来定义 Ingress 信息,对于这部分内容不熟悉的可以查看前面的网络章节部分的内容。然后直接创建上面的资源对象即可:
kubectl create ns minio
kubectl apply -f minio-deploy.yaml
kubectl apply -f minio-pvc.yaml
kubectl apply -f minio-ingress.yaml
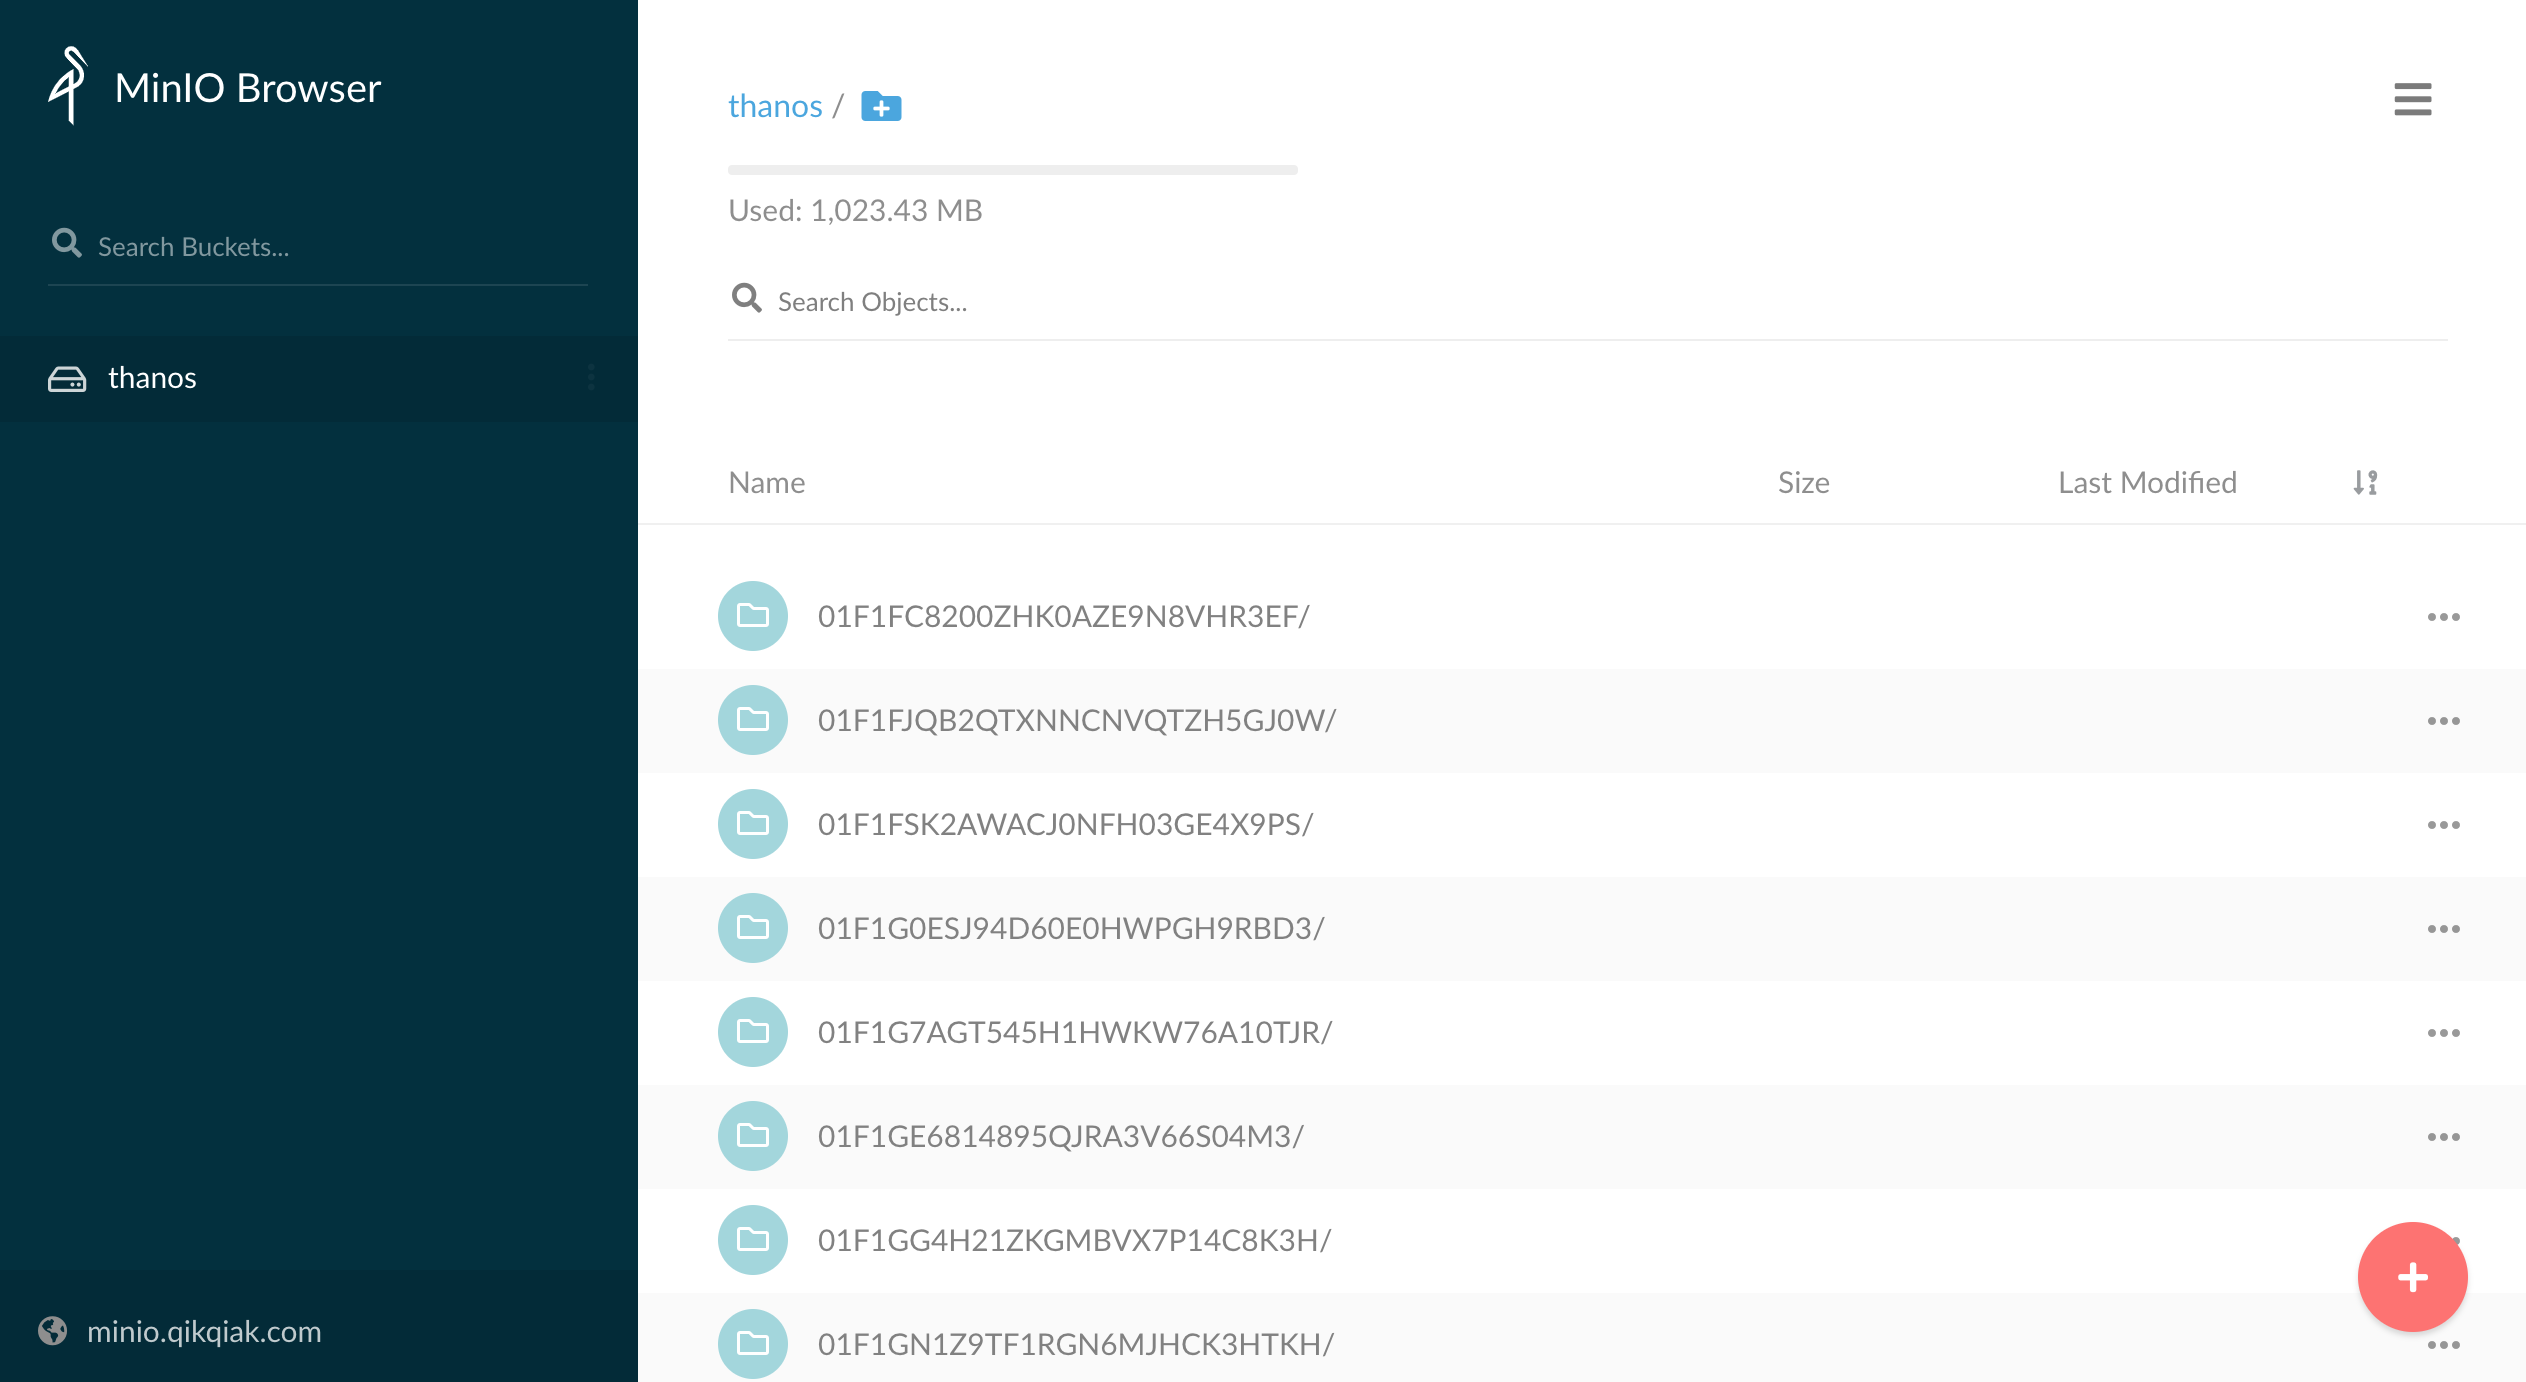
部署成功后,将域名 minio.qikqiak.com 解析到 Ingress 控制器所在的节点即可通过浏览器访问到 MinIO 服务了,通过上面定义的 MINIO_ACCESS_KEY 和 MINIO_SECRET_KEY 即可登录:
安装 Thanos Store
现在对象存储准备好了,我们就可以来部署 Store 组件了,该组件会从对象存储到给 Querier 提供 metrics 数据。
首先登录 MinIO 创建一个 thanos 的 bucket。然后创建一个对象存储配置文件:(thanos-storage-minio.yaml)
type: s3
config:
  bucket: thanos
  endpoint: minio.default.svc.cluster.local:9000
  access_key: minio
  secret_key: minio123
  insecure: true
  signature_version2: false
使用上面的配置文件来创建一个 Secret 对象:
$ kubectl create secret generic thanos-objectstorage --from-file=thanos.yaml=thanos-storage-minio.yaml -n kube-mon
secret/thanos-objectstorage created
然后创建 Store 组件的资源清单文件,这里有一个需要注意的地方是需要添加一个 thanos-store-api: "true" 的标签,这样前面我们创建的 thanos-store-gateway 这个 Headless Service 就可以自动发现到这个服务,Querier 组件查询数据的时候除了可以通过 Sidecar 去获取数据也可以通过这个 Store 组件去对象存储里面获取数据了。将上面的 Secret 对象通过 Volume 形式挂载到容器中的 /etc/secret 目录下,通过 objstore.config-file 参数指定即可:(store.yaml)
apiVersion: apps/v1
kind: StatefulSet
metadata:
  name: thanos-store-gateway
  namespace: kube-mon
  labels:
    app: thanos-store-gateway
spec:
  replicas: 1
  selector:
    matchLabels:
      app: thanos-store-gateway
  serviceName: thanos-store-gateway
  template:
    metadata:
      labels:
        app: thanos-store-gateway
        thanos-store-api: "true"
    spec:
      containers:
        - name: thanos
          image: thanosio/thanos:v0.18.0
          args:
            - "store"
            - "--log.level=debug"
            - "--data-dir=/data"
            - "--objstore.config-file=/etc/secret/thanos.yaml"
            - "--index-cache-size=500MB"
            - "--chunk-pool-size=500MB"
          ports:
            - name: http
              containerPort: 10902
            - name: grpc
              containerPort: 10901
          livenessProbe:
            httpGet:
              port: 10902
              path: /-/healthy
          readinessProbe:
            httpGet:
              port: 10902
              path: /-/ready
          volumeMounts:
            - name: object-storage-config
              mountPath: /etc/secret
              readOnly: false
      volumes:
        - name: object-storage-config
          secret:
            secretName: thanos-objectstorage
直接创建上面的资源对象即可:
$ kubectl apply -f store.yaml
$ kubectl get pods -n kube-mon -l thanos-store-api=true
NAME                     READY   STATUS    RESTARTS   AGE
prometheus-0             2/2     Running   0          15h
prometheus-1             2/2     Running   0          15h
thanos-store-gateway-0   1/1     Running   0          100s
部署成功后这个时候去 Thano 的 Querier 页面上查看 Store 信息就可以发现这里我们配置的 Store 组件了:
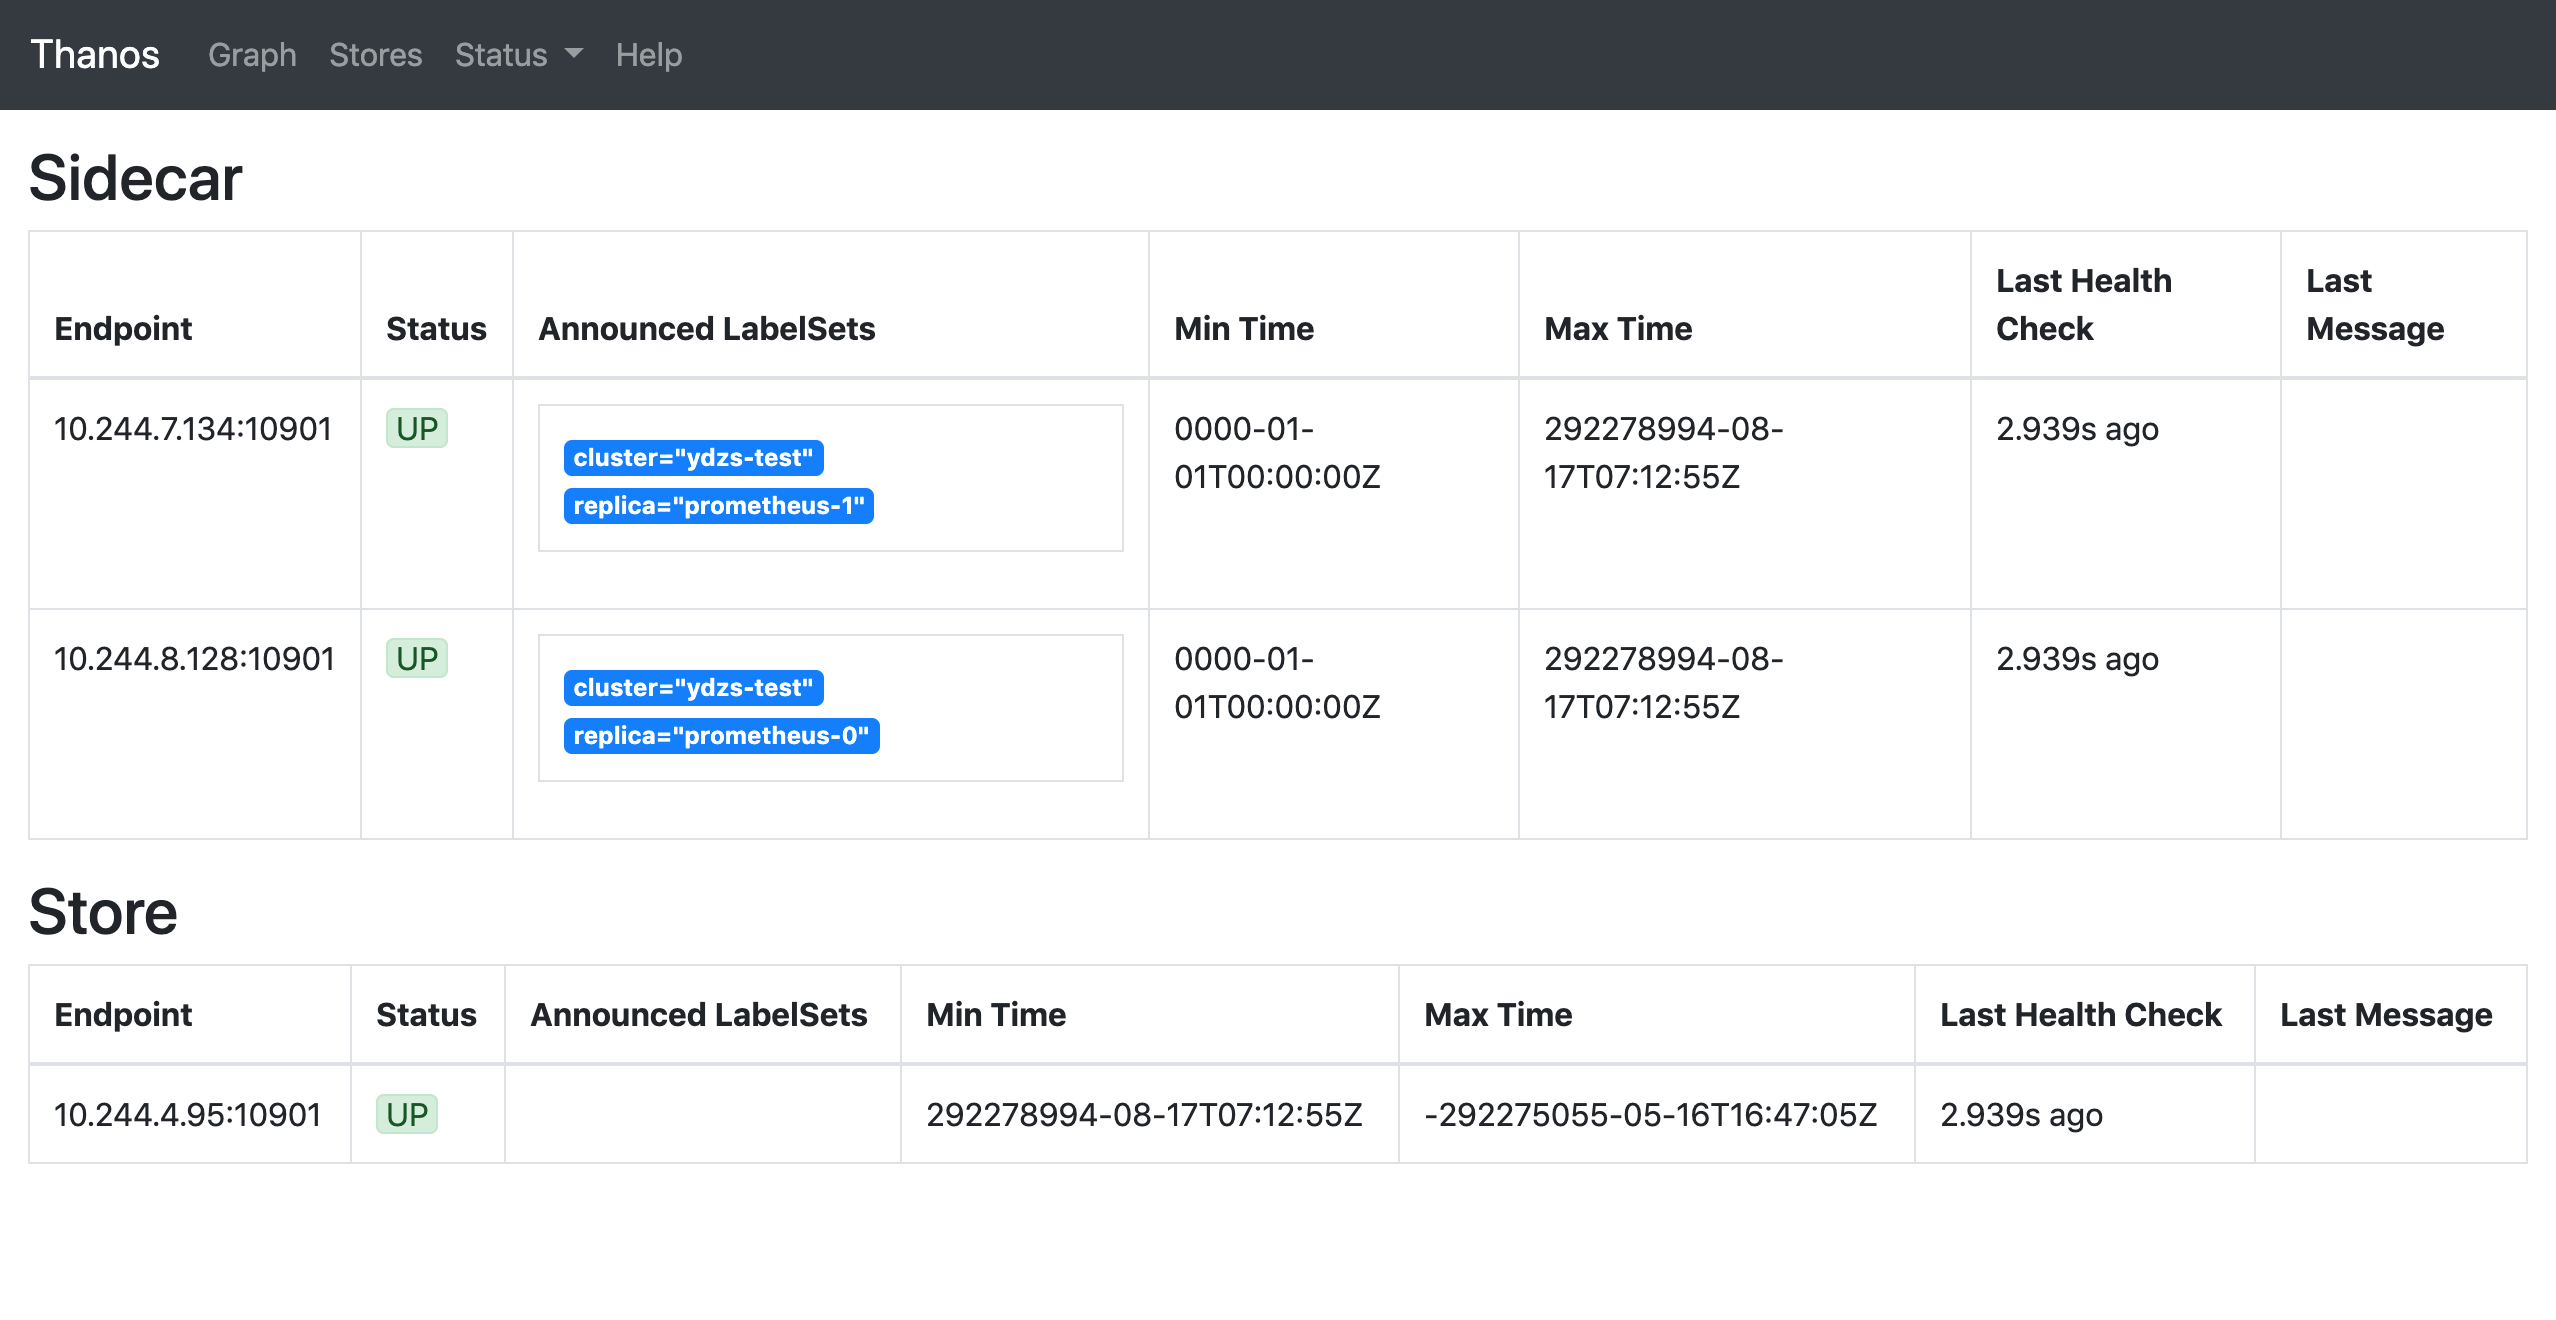
到这里证明我们的 Thanos 组件也配置成功了。但是还有一个明显的问题是这里我们只是配置去对象存储中查询数据的组件,那什么地方往对象存储中写入数据呢?当然还是在 Sidecar 组件里面了。所以同样我们需要把 objstore.config-file 参数和 Secret 对象也要配置到 Sidecar 组件中去:
......
volumes:
- name: object-storage-config
  secret:
    secretName: thanos-objectstorage
......
args:
- sidecar
- --log.level=debug
- --tsdb.path=/prometheus
- --prometheus.url=http://localhost:9090
- --reloader.config-file=/etc/prometheus/prometheus.yaml.tmpl
- --reloader.config-envsubst-file=/etc/prometheus-shared/prometheus.yaml
- --reloader.rule-dir=/etc/prometheus/rules/
- --objstore.config-file=/etc/secret/thanos.yaml
......
volumeMounts:
- name: object-storage-config
  mountPath: /etc/secret
  readOnly: false
......
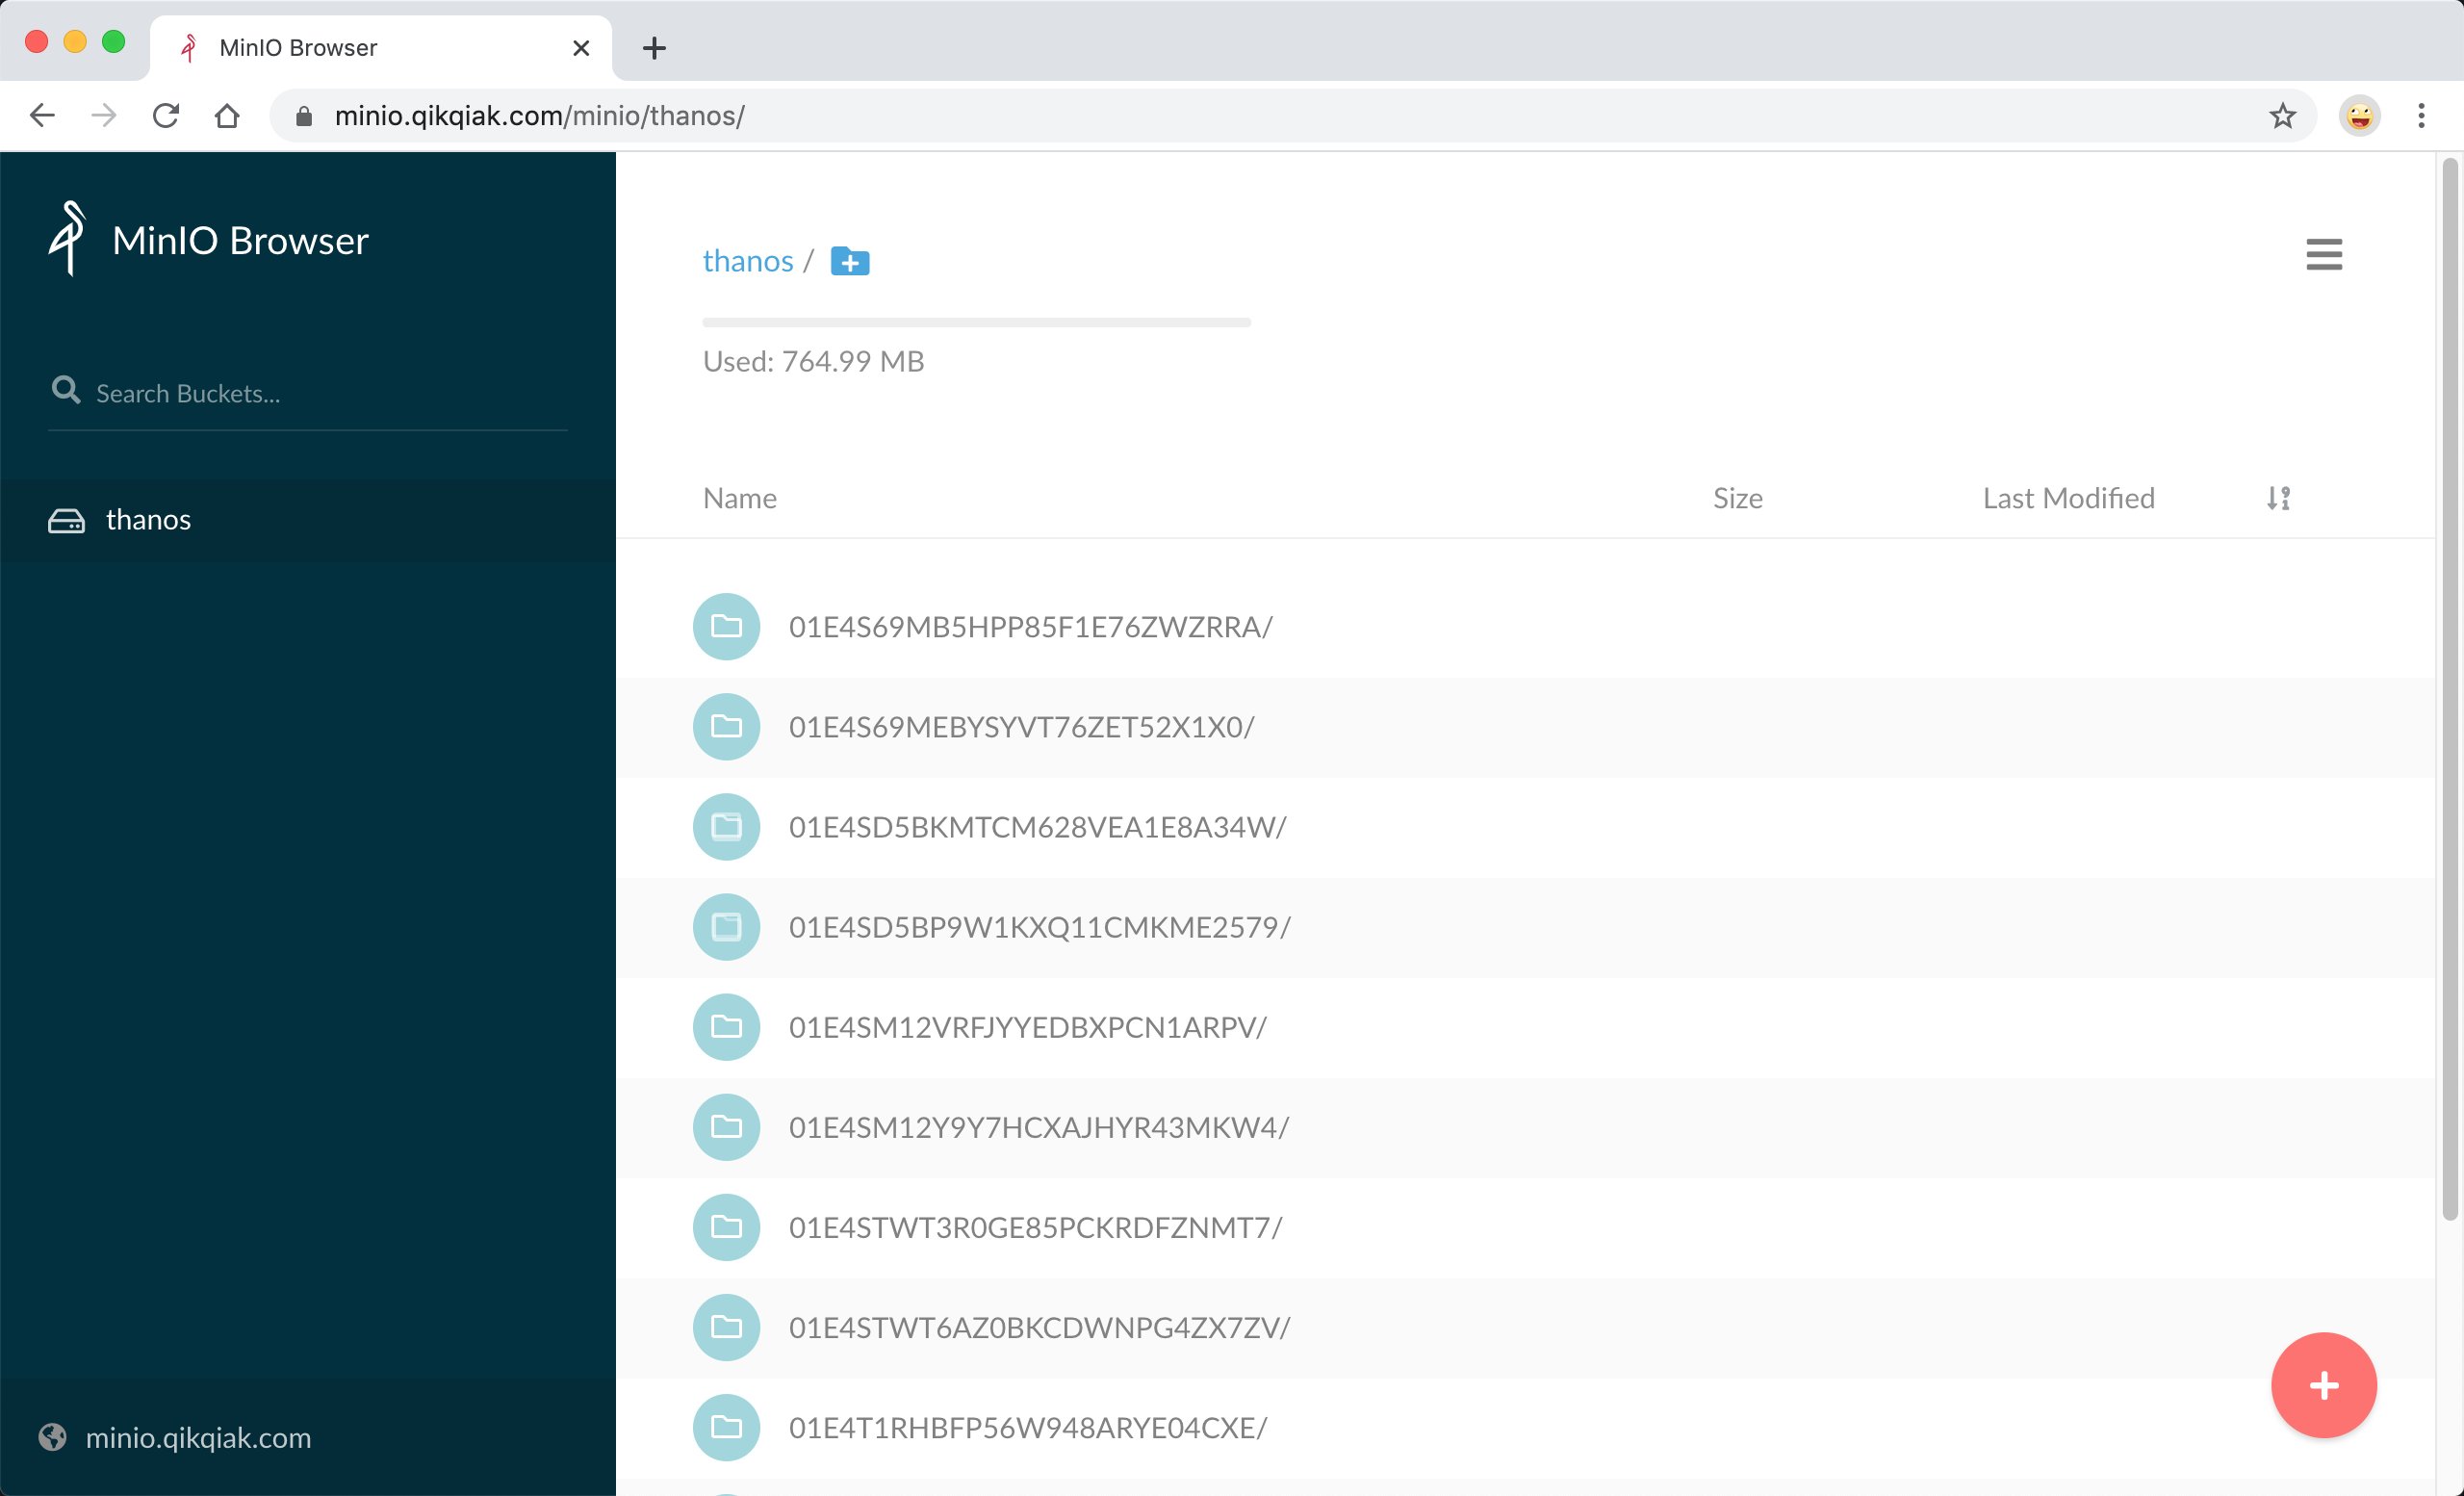
配置完成后重新更新 Sidecar 组件即可。配置生效过后正常的话就会有数据传入到 MinIO 里面去了,我们可以去 MinIO 的页面上查看验证:
Compactor 组件
现在历史监控数据已经上传到对象存储中去了,但是由于监控数据量非常庞大,所以一般情况下我们会去安装一个 Thanos 的 Compactor 组件,用来将对象存储中的数据进行压缩和下采样。Compactor 组件的部署和 Store 非常类似,指定对象存储的配置文件即可,如下所示的资源清单文件:(compactor.yaml)
apiVersion: apps/v1
kind: StatefulSet
metadata:
  name: thanos-compactor
  namespace: kube-mon
  labels:
    app: thanos-compactor
spec:
  replicas: 1
  selector:
    matchLabels:
      app: thanos-compactor
  serviceName: thanos-compactor
  template:
    metadata:
      labels:
        app: thanos-compactor
    spec:
      containers:
        - name: thanos
          image: thanosio/thanos:v0.18.0
          args:
            - "compact"
            - "--log.level=debug"
            - "--data-dir=/data"
            - "--objstore.config-file=/etc/secret/thanos.yaml"
            - "--wait"
          ports:
            - name: http
              containerPort: 10902
          livenessProbe:
            httpGet:
              port: 10902
              path: /-/healthy
            initialDelaySeconds: 10
          readinessProbe:
            httpGet:
              port: 10902
              path: /-/ready
            initialDelaySeconds: 15
          volumeMounts:
            - name: object-storage-config
              mountPath: /etc/secret
              readOnly: false
      volumes:
        - name: object-storage-config
          secret:
            secretName: thanos-objectstorage
最重要的还是提供对象存储的配置文件,然后直接创建上面的资源清单文件:
$ kubectl apply -f compactor.yaml
$ kubectl get pods -n kube-mon -l app=thanos-compactor
NAME                 READY   STATUS    RESTARTS   AGE
thanos-compactor-0   1/1     Running   0          68s
到这里我们就完成了使用 Thanos 来部署高可用的 Prometheus 集群,当然 Thanos 还有其他的一些组件,比如 Check、Bucket、Receiver 等,对于这些组件的使用感兴趣的可以查看官方文档 https://thanos.io/。
将 Thanos 与 Prometheus 集成可让我们对 Prometheus 进行水平伸缩。由于 Thanos Querier 可以从其他查询器实例中提取指标,因此我们也可以跨集群提取指标并在 Grafana 中可视化它们,Thanos 使我们可以将度量标准数据归档到对象存储中,该对象存储为我们的监控系统提供了无限的存储空间,而且它还可以从对象存储中提供指标,如果我们对这些对象存储设置一些适当的保留策略,还可以将费用降到更低。
Receiver 组件
前面我们介绍主要组件的时候提到了一个 Receiver 组件,那为什么上面在使用 Thanos 的时候并没有用到呢?其实这是因为 Receiver 和 Sidecar 是 Thanos 的两种不同架构模式,之前 Receiver 只是一种实验特性,现在已经是 GA 状态了,所以非常有必要来了解下。那么 Receiver 到底有什么作用呢?和 Sidecar 的区别是什么?
我们知道 Sidecar 模式是在每一个 Prometheus 的实例旁边添加一个 Sidecar 组件来上传数据,但是数据上传并不是实时的,而是每 2h 上传一个数据块,而且当通过 Querier 组件查询的时候,如果 Sidecar 非常多,那么势必会造成很多的资源消耗,这也是现在使用的 Sidecar 模式的弊端。
Thanos Receiver 组件可以接收来自任何 Prometheus 实例的 remote write 远程写入请求,并将数据存储在其本地 TSDB 中,同样我们也可以选择将这些 TSDB 块定期上传到对象存储中。此外 Receiver 同样也暴露了 StoreAPI 接口,这样 Thanos Querier 组件也是可以实时查询接收到的指标了,完全不需要去所有的 Sidecar 上查询最新的数据。
另外 Thanos Receiver 组件也支持多租户,通过传入请求的 HTTP Header 头 THANOS-TENANT 的值来确定租户 Prometheus 的 ID,为了防止数据库级别的数据泄露,每个租户都有一个单独的 TSDB 实例,Thanos Receiver 还通过暴露类似于 Prometheus 的 external_label 来支持多租户。
                 +
Tenant's Premise | Provider Premise
                 |
                 |            +------------------------+
                 |            |                        |
                 |  +-------->+     Object Storage     |
                 |  |         |                        |
                 |  |         +-----------+------------+
                 |  |                     ^
                 |  | S3 API              | S3 API
                 |  |                     |
                 |  |         +-----------+------------+
                 |  |         |                        |       Store API
                 |  |         |  Thanos Store Gateway  +<-----------------------+
                 |  |         |                        |                        |
                 |  |         +------------------------+                        |
                 |  |                                                           |
                 |  +---------------------+                                     |
                 |                        |                                     |
+--------------+ |            +-----------+------------+              +---------+--------+
|              | | Remote     |                        |  Store API   |                  |
|  Prometheus  +------------->+     Thanos Receiver    +<-------------+  Thanos Querier  |
|              | | Write      |                        |              |                  |
+--------------+ |            +------------------------+              +---------+--------+
                 |                                                              ^
                 |                                                              |
+--------------+ |                                                              |
|              | |                PromQL                                        |
|    User      +----------------------------------------------------------------+
|              | |
+--------------+ |
                 +
如果我们需要负载均衡和数据多副本等功能,则可以将 Thanos Receiver 的多个实例作为单个 hash 的一部分来运行,每个 Receiver 在 hashring 中的位置决定了哪些时间序列被哪个 Receiver 接收和存储。下面是一个 hashring 的配置文件示例:
[
  {
    "hashring": "tenant-a",
    "endpoints": [
      "tenant-a-1.metrics.local:19291/api/v1/receive",
      "tenant-a-2.metrics.local:19291/api/v1/receive"
    ],
    "tenants": ["tenant-a"]
  },
  {
    "hashring": "tenants-b-c",
    "endpoints": [
      "tenant-b-c-1.metrics.local:19291/api/v1/receive",
      "tenant-b-c-2.metrics.local:19291/api/v1/receive"
    ],
    "tenants": ["tenant-b", "tenant-c"]
  },
  {
    "hashring": "soft-tenants",
    "endpoints": ["http://soft-tenants-1.metrics.local:19291/api/v1/receive"]
  }
]
这里多租户涉及到两个概念:
- soft-tenants(软租户):如果 hashring 未指定任何明确的租户,则任何租户都被视为有效的匹配,这允许集群提供软租用。租户 ID 和其他任何 hashring 都不明确匹配的请求将自动进入此软租户 hashring。所有未在 HTTP 请求中设置租户 header 的传入远程写请求都属于软租约,并且默认租户 ID(可以通过标志
--receive.default-tenant-id进行配置)都会附加到 metrics 指标上。 - hard-tenants(硬租户):硬租户必须在每个 HTTP 请求中设置租户 header 信息,Thanos Receiver 中的硬租户在 hashring 配置文件中进行配置,比如使用配置管理工具来协调对该配置的更改,当 Thanos Receiver 接收到远程写请求的时候,它将遍历已配置的硬租户列表,硬租户还具有属于它的关联接收方端点的数量。
PS:远程写请求最初可以由任何 Receiver 实例接收,但是,将仅分发到与该硬租户相对应的 Receiver 端点。
                                  Soft tenant hashring
                                 +-----------------------+
                                 |                       |
+-----------------+              |  +-----------------+  |
|                 |              |  |                 |  |
|  Load Balancer  +-------+      |  | Thanos receiver |  |
|                 |       |      |  |                 |  |
+-----------------+       |      |  +-----------------+  |
                          |      |                       |
                          |      |                       |
                          |      |  +-----------------+  |
                          |      |  |                 |  |
                          +-------->+ Thanos receiver +-----------+
                                 |  |                 |  |        |
                                 |  +-----------------+  |        |
                                 |                       |        |
                                 +-----------------------+        |
                                                                  |
                                   Hard Tenant A hashring         |
                                 +-----------------------+        |
                                 |                       |        |
                                 |  +-----------------+  |        |
                                 |  |                 |  |        |
                                 |  | Thanos receiver +<----------+
                                 |  |                 |  |        |
                                 |  +-----------------+  |        |
                                 |                       |        |
                                 |                       |        |
                                 |  +-----------------+  |        |
                                 |  |                 |  |        |
                                 |  | Thanos receiver +<----------+
                                 |  |                 |  |
                                 |  +-----------------+  |
                                 |                       |
                                 +-----------------------+
接下来我们来安装配置 Thanos Receiver 组件,现在我们的 Prometheus 数据是通过 Remote Write API 实时上传到 Receiver 组件上面去的,所以我们需要对 Receiver 组件进行数据持久化,然后指定 objstore 后可以将数据上传到对象存储中去,对应的资源清单文件如下所示:
# receiver.yaml
apiVersion: apps/v1
kind: StatefulSet
metadata:
  labels:
    app: thanos-receiver
  name: thanos-receiver
  namespace: kube-mon
spec:
  selector:
    matchLabels:
      app: thanos-receiver
  serviceName: thanos-receiver
  replicas: 1
  template:
    metadata:
      labels:
        app: thanos-receiver
        thanos-store-api: "true"
    spec:
      containers:
        - image: thanosio/thanos:v0.18.0
          args:
            - receive
            - --grpc-address=0.0.0.0:10901
            - --http-address=0.0.0.0:10902
            - --remote-write.address=0.0.0.0:19291
            - --receive.replication-factor=1
            - --objstore.config-file=/etc/secret/thanos.yaml
            - --tsdb.path=/var/thanos/receiver
            - --tsdb.retention=1d
            - --label=receive_replica="$(NAME)"
            - --receive.local-endpoint=$(NAME).thanos-receiver.$(NAMESPACE).svc.cluster.local:10901
          env:
            - name: NAME
              valueFrom:
                fieldRef:
                  fieldPath: metadata.name
            - name: NAMESPACE
              valueFrom:
                fieldRef:
                  fieldPath: metadata.namespace
          livenessProbe:
            failureThreshold: 8
            httpGet:
              path: /-/healthy
              port: 10902
              scheme: HTTP
            periodSeconds: 30
          name: thanos-receive
          ports:
            - containerPort: 10901
              name: grpc
            - containerPort: 10902
              name: http
            - containerPort: 19291
              name: remote-write
          readinessProbe:
            failureThreshold: 20
            httpGet:
              path: /-/ready
              port: 10902
              scheme: HTTP
            periodSeconds: 5
          volumeMounts:
            - mountPath: /var/thanos/receiver
              name: data
              readOnly: false
            - name: object-storage-config
              mountPath: /etc/secret
              readOnly: false
      volumes:
        - name: object-storage-config
          secret:
            secretName: thanos-objectstorage
  volumeClaimTemplates:
    - metadata:
        name: data
        labels:
          app: thanos-receiver
      spec:
        storageClassName: openebs-jiva-default
        accessModes:
          - ReadWriteOnce
        resources:
          requests:
            storage: 20Gi
---
apiVersion: v1
kind: Service
metadata:
  name: thanos-receiver
  namespace: kube-mon
spec:
  clusterIP: None
  ports:
    - name: grpc
      port: 10901
      targetPort: 10901
    - name: http
      port: 10902
      targetPort: 10902
    - name: remote-write
      port: 19291
      targetPort: 19291
  selector:
    app: thanos-receiver
此外还有一个需要注意的点是现在 Receiver 也变成了 Querier 组件的一个数据源了,所以这里我们给上面的 Pod 增加一个 thanos-store-api: "true" 的标签,这样可以让 Querier 自动发现这个 Pod。直接创建上面的资源清单即可:
kubectl apply -f receiver.yaml
创建完成后可以得到我们的远程写 API 地址为:http://thanos-receiver:19291/api/v1/receive。
由于现在我们使用 Receiver 模式了,所以之前的 Sidecar 模式就不需要了,可以先将之前的 Sidecar 删除掉,其实现在我们的 Prometheus 变成了近乎无状态的了,只需要 Prometheus 应用本身,然后加上 remotewrite api 地址即可:
# configmap.yaml
apiVersion: v1
kind: ConfigMap
metadata:
  name: prometheus-config
  namespace: kube-mon
data:
  prometheus.yaml.tmpl: |
    global:
      scrape_interval: 15s
      scrape_timeout: 15s
      external_labels:
        cluster: ydzs-test
        replica: $(POD_NAME)  # 每个 Prometheus 有一个唯一的标签

    rule_files:  # 报警规则文件配置
    - /etc/prometheus/rules/*rules.yaml

    # 指定 remote write 地址
    remote_write:
    - url: http://thanos-receiver:19291/api/v1/receive

    ......
正常是不需要 Sidecar 容器了,这里我们为了用一个 StatefulSet 来运行两个 Prometheus 副本,借助 Sidecar 来帮我们渲染 prometheus.yaml.tmpl 模板文件(因为 Prometheus 本身是不支持环境变量替换的),这里的 Sidecar 仅作渲染用,后续可以换成其他方式:
# sidecar.yaml
apiVersion: apps/v1
kind: StatefulSet
metadata:
  name: prometheus
  namespace: kube-mon
  labels:
    app: prometheus
spec:
  serviceName: "prometheus"
  replicas: 2
  selector:
    matchLabels:
      app: prometheus
  template:
    metadata:
      labels:
        app: prometheus
    spec:
      serviceAccountName: prometheus
      volumes:
        - name: prometheus-config
          configMap:
            name: prometheus-config
        - name: prometheus-rules
          configMap:
            name: prometheus-rules
        - name: prometheus-config-shared
          emptyDir: {}
      containers:
        - name: prometheus
          image: prom/prometheus:v2.14.0
          imagePullPolicy: IfNotPresent
          args:
            - "--config.file=/etc/prometheus-shared/prometheus.yaml"
            - "--storage.tsdb.path=/prometheus"
            - "--storage.tsdb.retention.time=6h"
            - "--storage.tsdb.no-lockfile"
            - "--storage.tsdb.min-block-duration=2h" # Thanos处理数据压缩
            - "--storage.tsdb.max-block-duration=2h"
            - "--web.enable-admin-api" # 通过一些命令去管理数据
            - "--web.enable-lifecycle" # 支持热更新  localhost:9090/-/reload 加载
          ports:
            - name: http
              containerPort: 9090
          resources:
            requests:
              memory: "2Gi"
              cpu: "1"
            limits:
              memory: "2Gi"
              cpu: "1"
          volumeMounts:
            - name: prometheus-config-shared
              mountPath: /etc/prometheus-shared/
            - name: prometheus-rules
              mountPath: /etc/prometheus/rules
            - name: prometheus-config
              mountPath: /etc/prometheus
        - name: thanos
          image: thanosio/thanos:v0.18.0
          imagePullPolicy: IfNotPresent
          args:
            - sidecar
            - --log.level=debug
            - --reloader.config-file=/etc/prometheus/prometheus.yaml.tmpl
            - --reloader.config-envsubst-file=/etc/prometheus-shared/prometheus.yaml
            - --reloader.rule-dir=/etc/prometheus/rules/
          ports:
            - name: http-sidecar
              containerPort: 10902
            - name: grpc
              containerPort: 10901
          env:
            - name: POD_NAME
              valueFrom:
                fieldRef:
                  fieldPath: metadata.name
          volumeMounts:
            - name: prometheus-config-shared
              mountPath: /etc/prometheus-shared/
            - name: prometheus-config
              mountPath: /etc/prometheus
            - name: prometheus-rules
              mountPath: /etc/prometheus/rules
重新创建 Prometheus:
$ kubectl delete -f configmap.yaml
$ kubectl delete -f sidecar.yaml
$ kubectl apply -f configmap.yaml
$ kubectl apply -f sidecar.yaml
$ kubectl get pods -n kube-mon
NAME                              READY   STATUS    RESTARTS   AGE
alertmanager-86c756695f-b92zh     1/1     Running   0          38h
dingtalk-hook-66c75955d-mjpdc     1/1     Running   0          38h
grafana-67c7856c69-kjcvp          1/1     Running   0          23h
node-exporter-gvbmd               1/1     Running   0          23h
node-exporter-tx4p2               1/1     Running   0          166m
node-exporter-wfp4j               1/1     Running   0          36h
node-exporter-x8gjs               1/1     Running   0          27d
prometheus-0                      2/2     Running   0          5m8s
prometheus-1                      2/2     Running   0          5m1s
thanos-compactor-0                1/1     Running   0          3h44m
thanos-querier-77b47f7948-4sjhc   1/1     Running   0          3h9m
thanos-receiver-0                 1/1     Running   0          40m
thanos-store-gateway-0            1/1     Running   0          3h10m
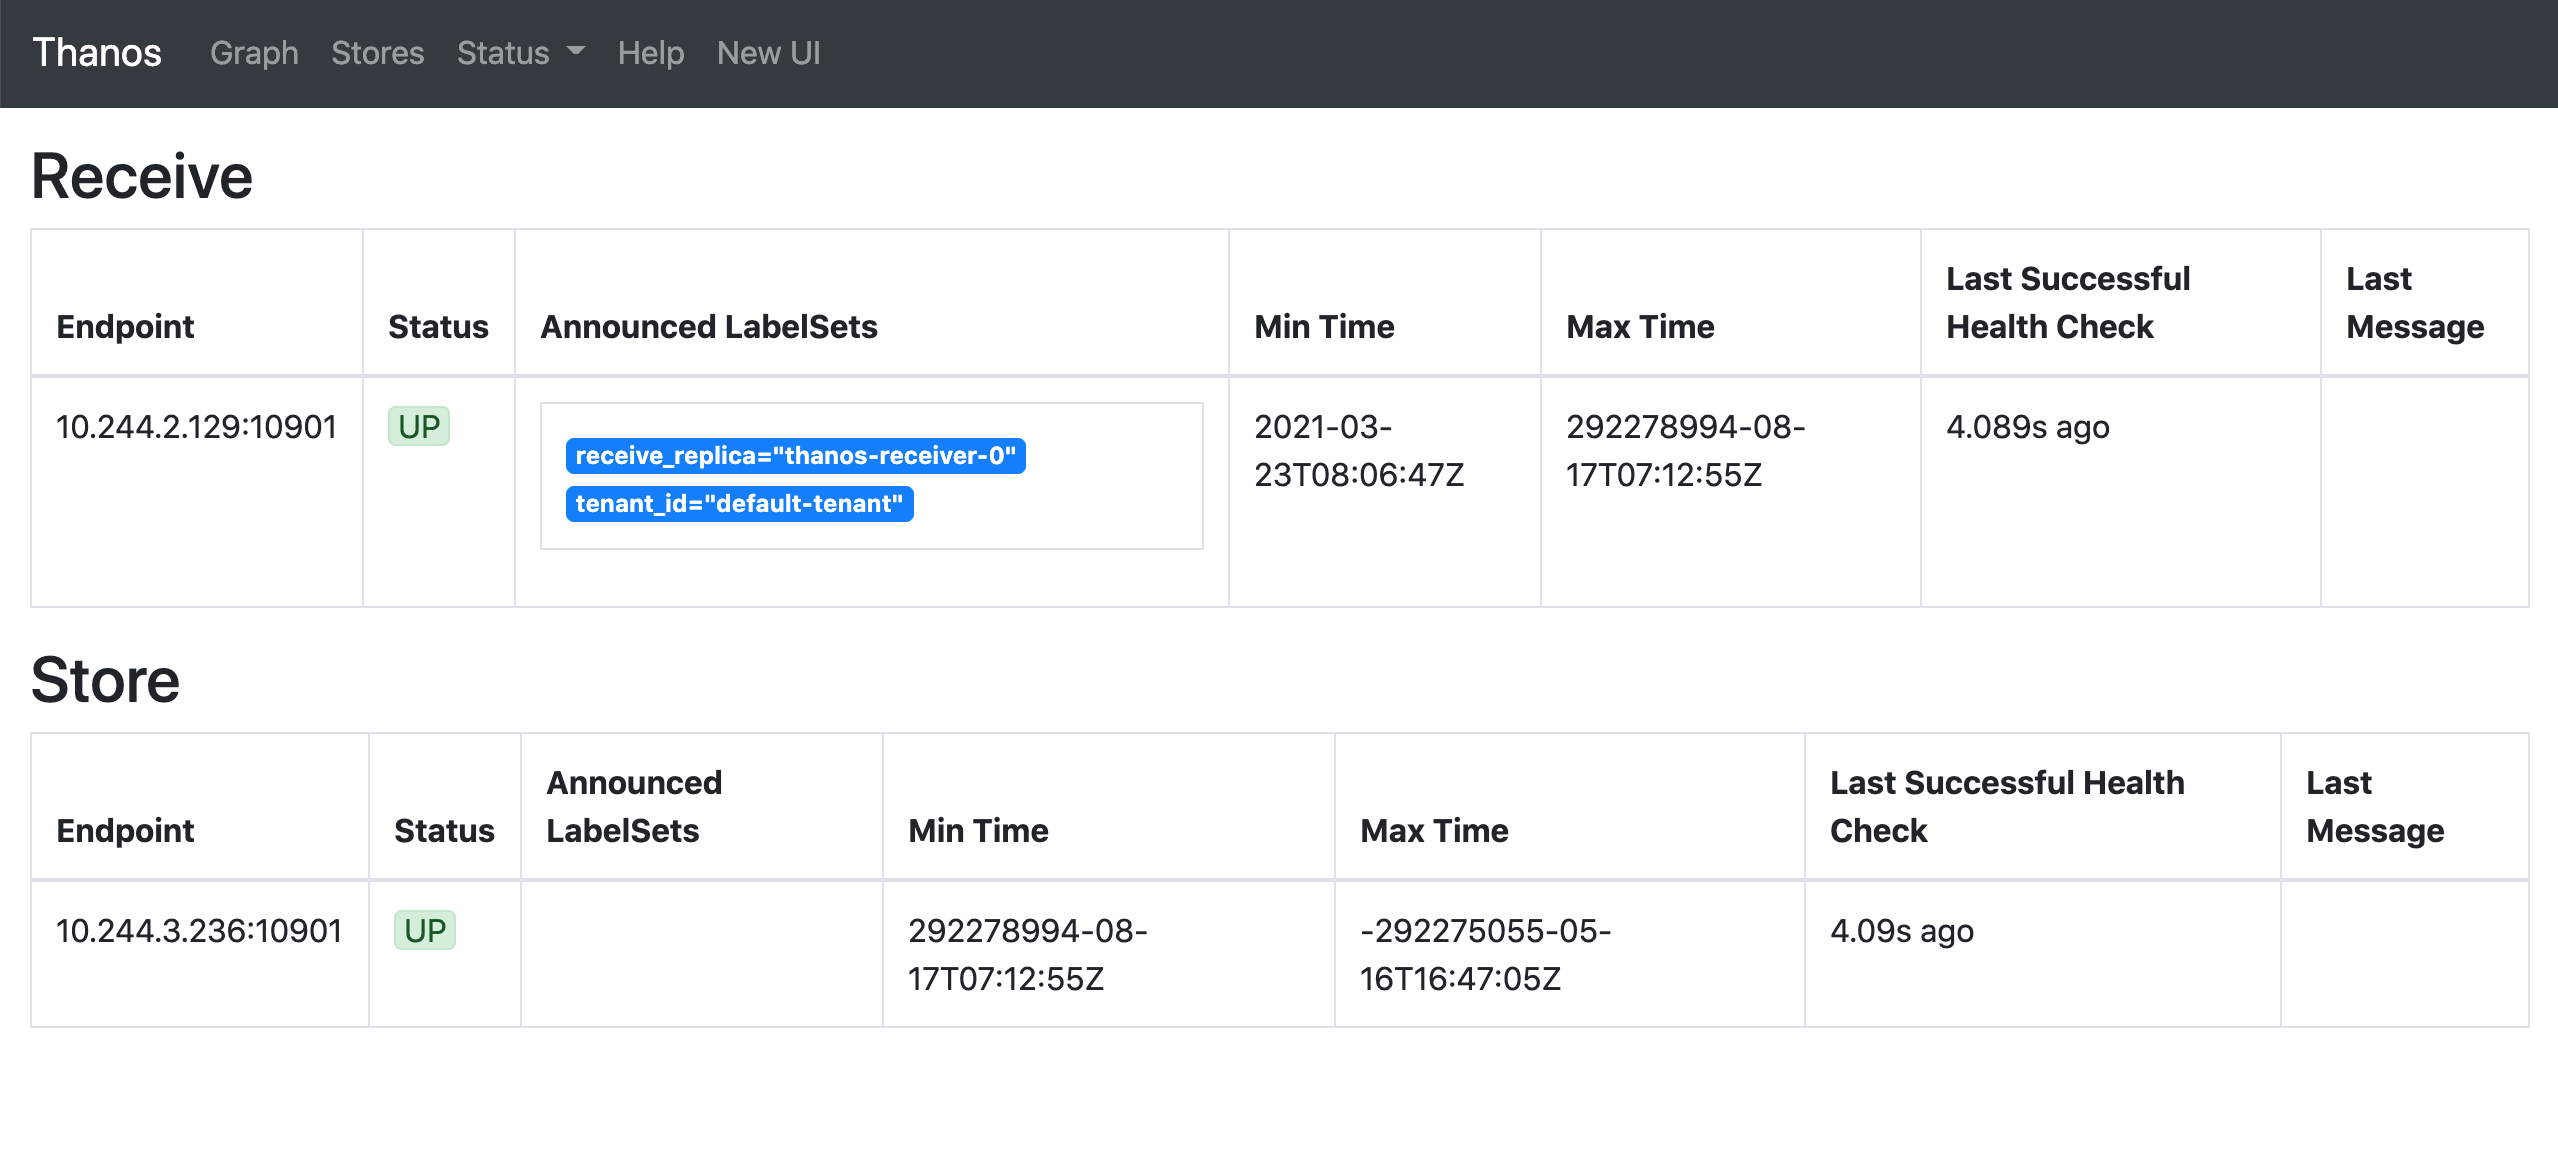
部署完成后正常这个时候 Prometheus 就已经开始实时远程写入数据到 Receiver 去了,我们可以通过 Querier 的界面可以查看到现在发现的 Stores:
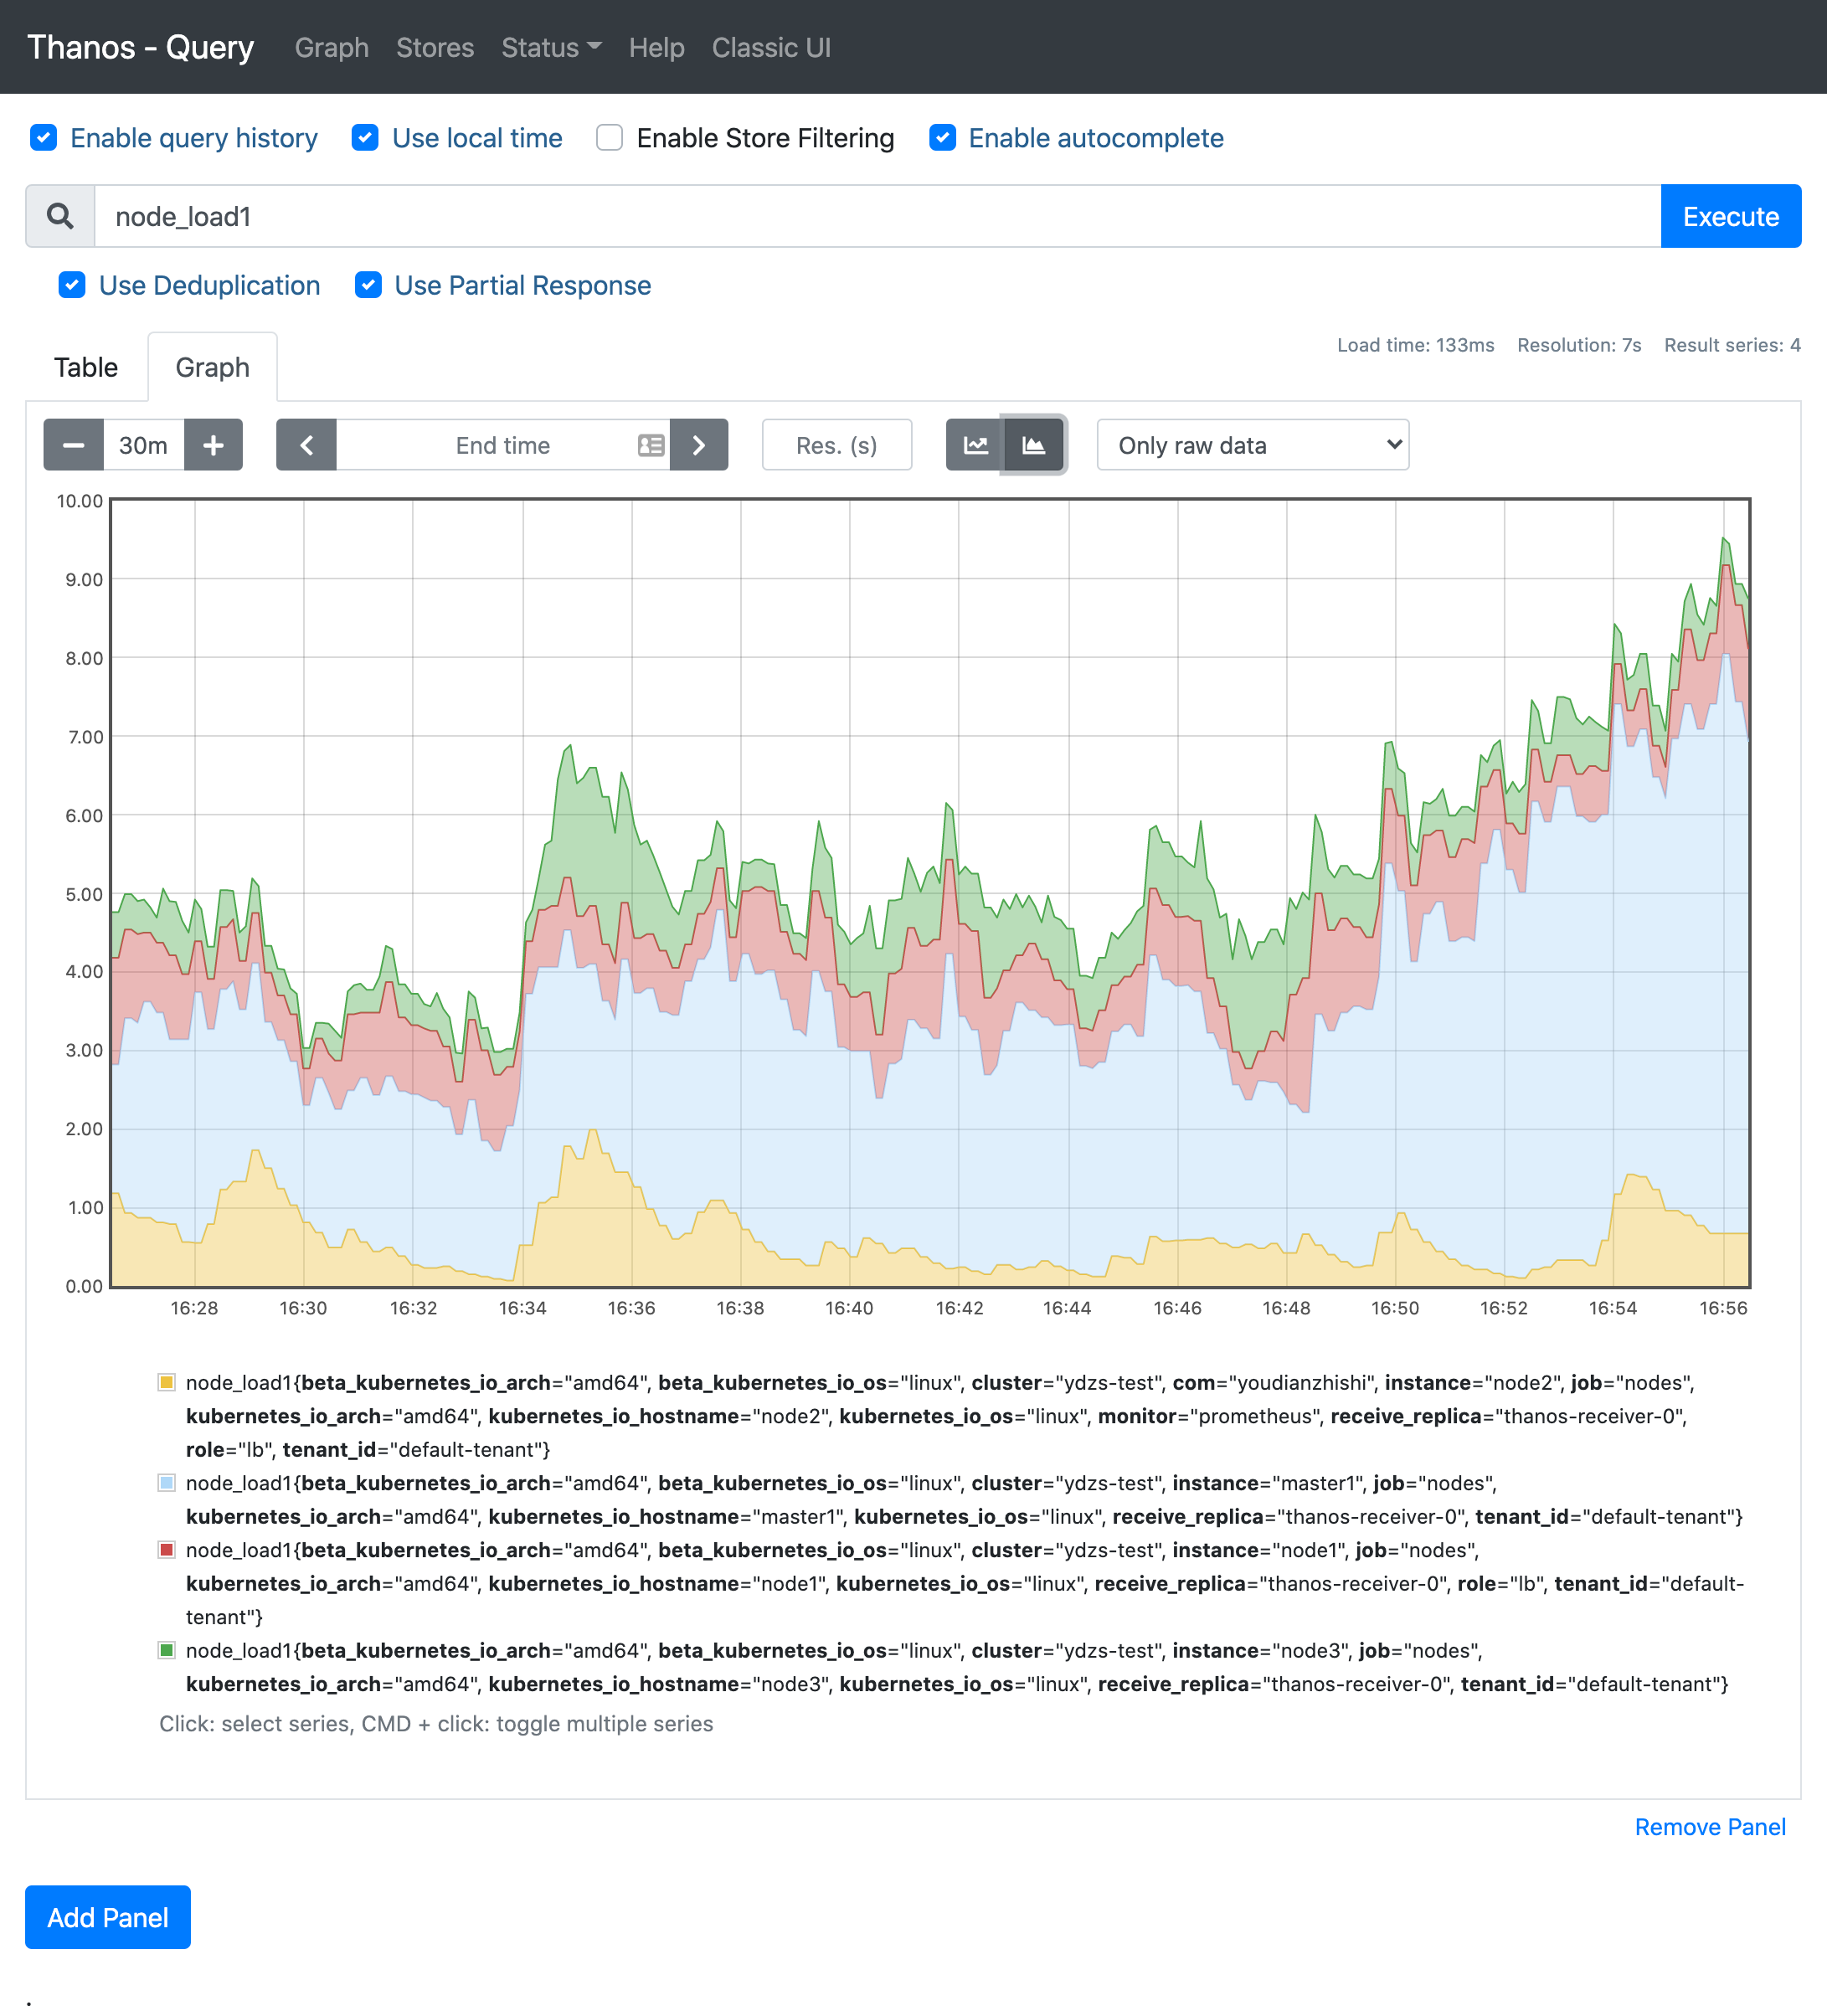
然后切换到 Graph 页面查询 node_load1,先去掉 deduplication:
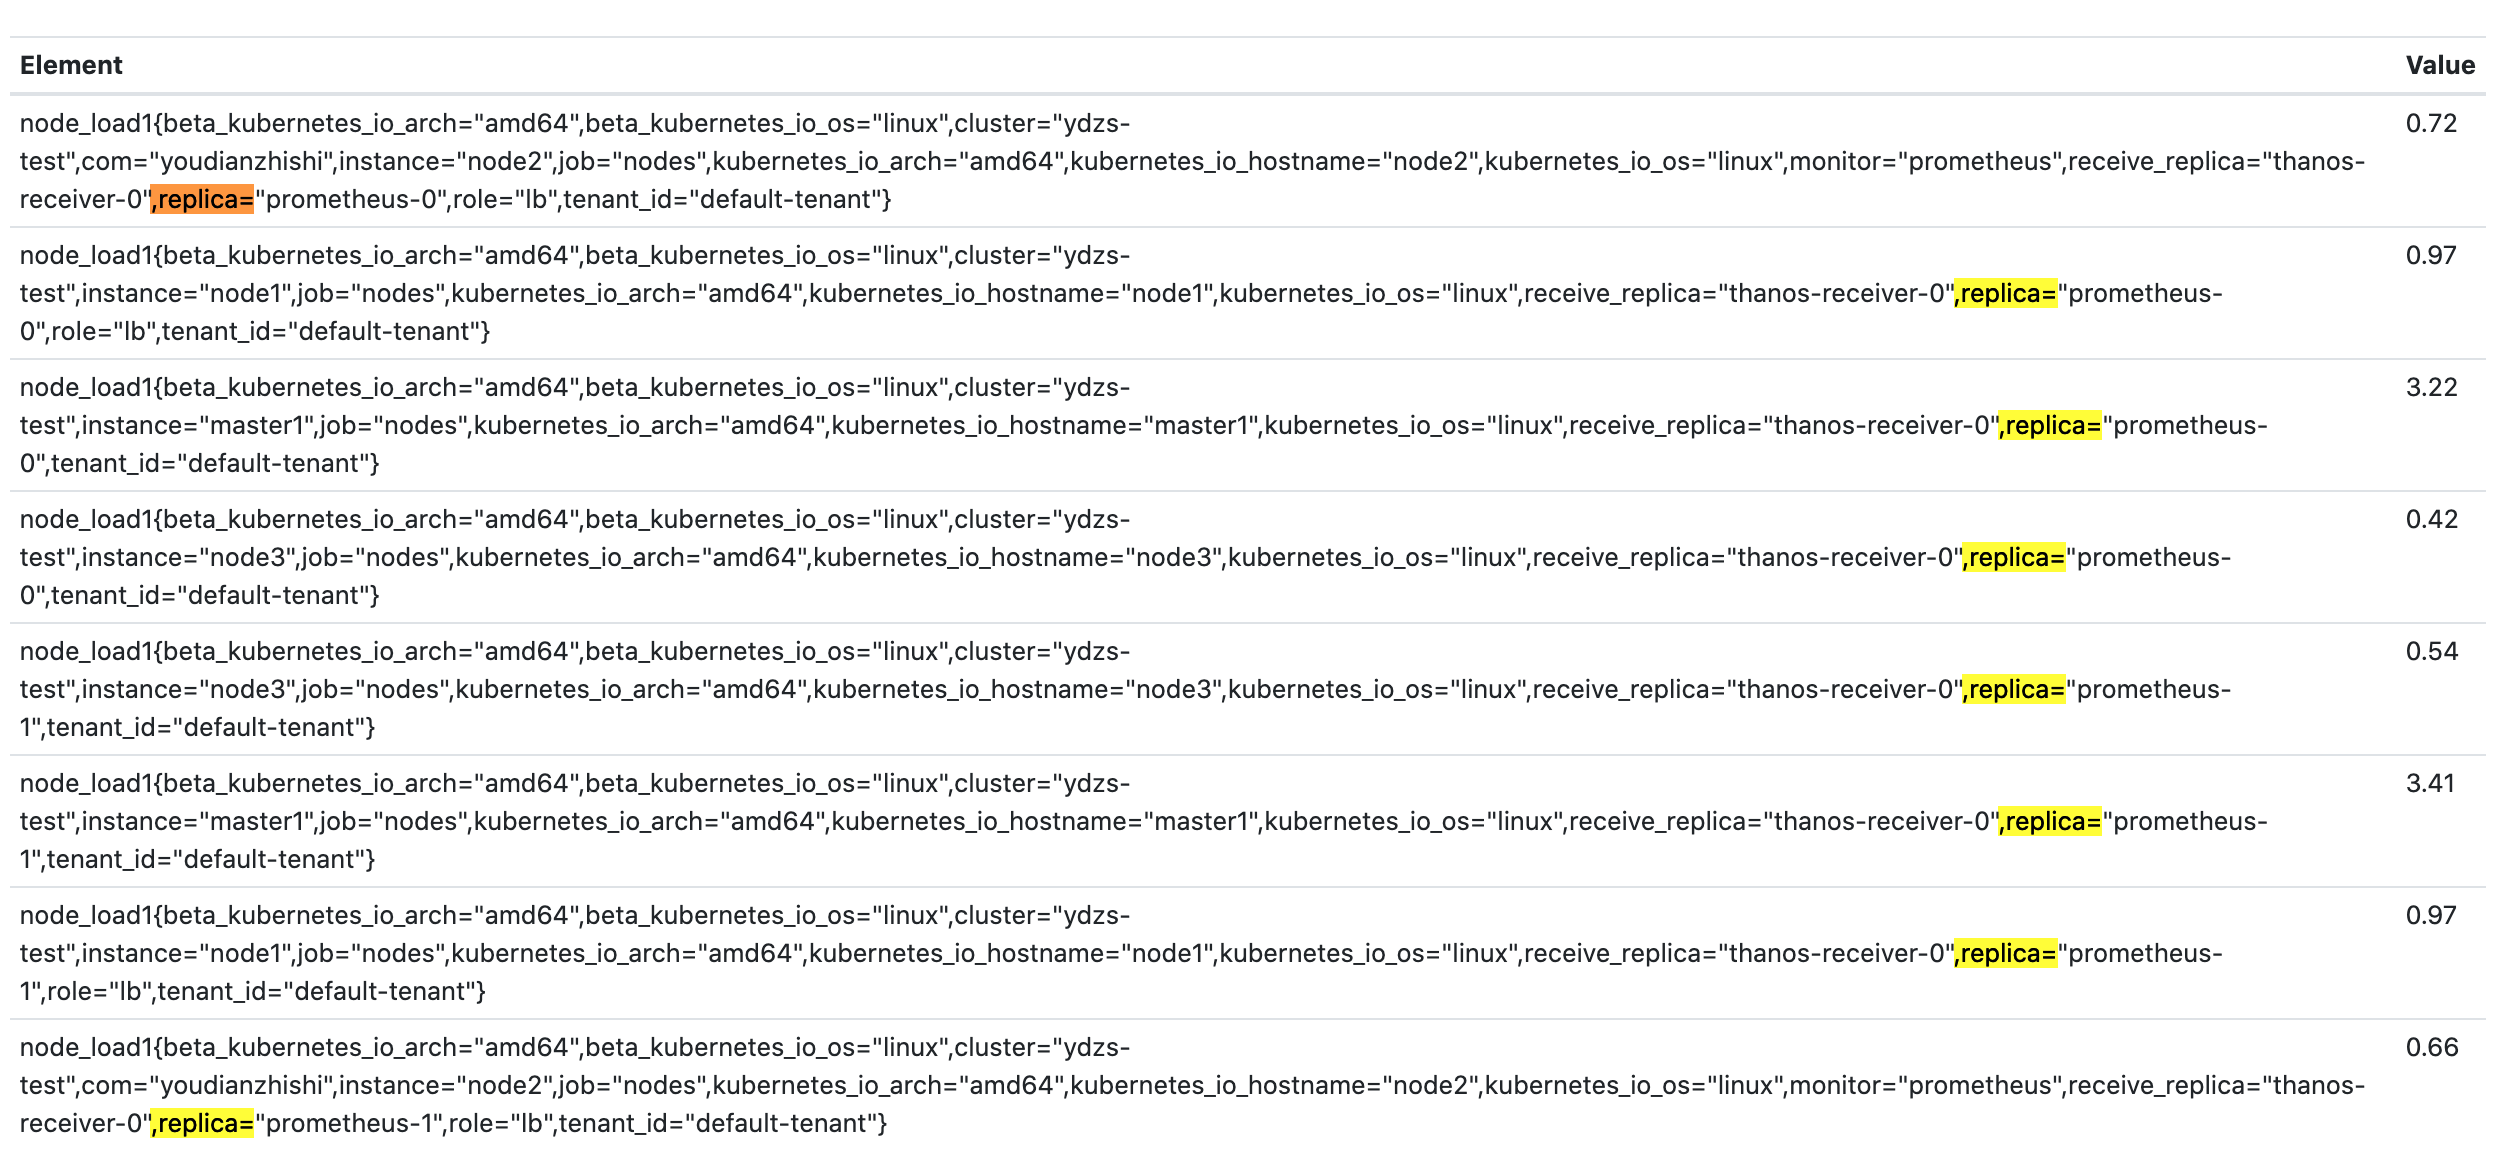
可以看到已经查询到了两个 Prometheus 实例的数据,这证明我们数据已经成功上传到 Receiver 了,这里的数据其实是通过 Receiver 获取到的,然后勾选上 deduplication 后可以根据 replica 标签进行去重:
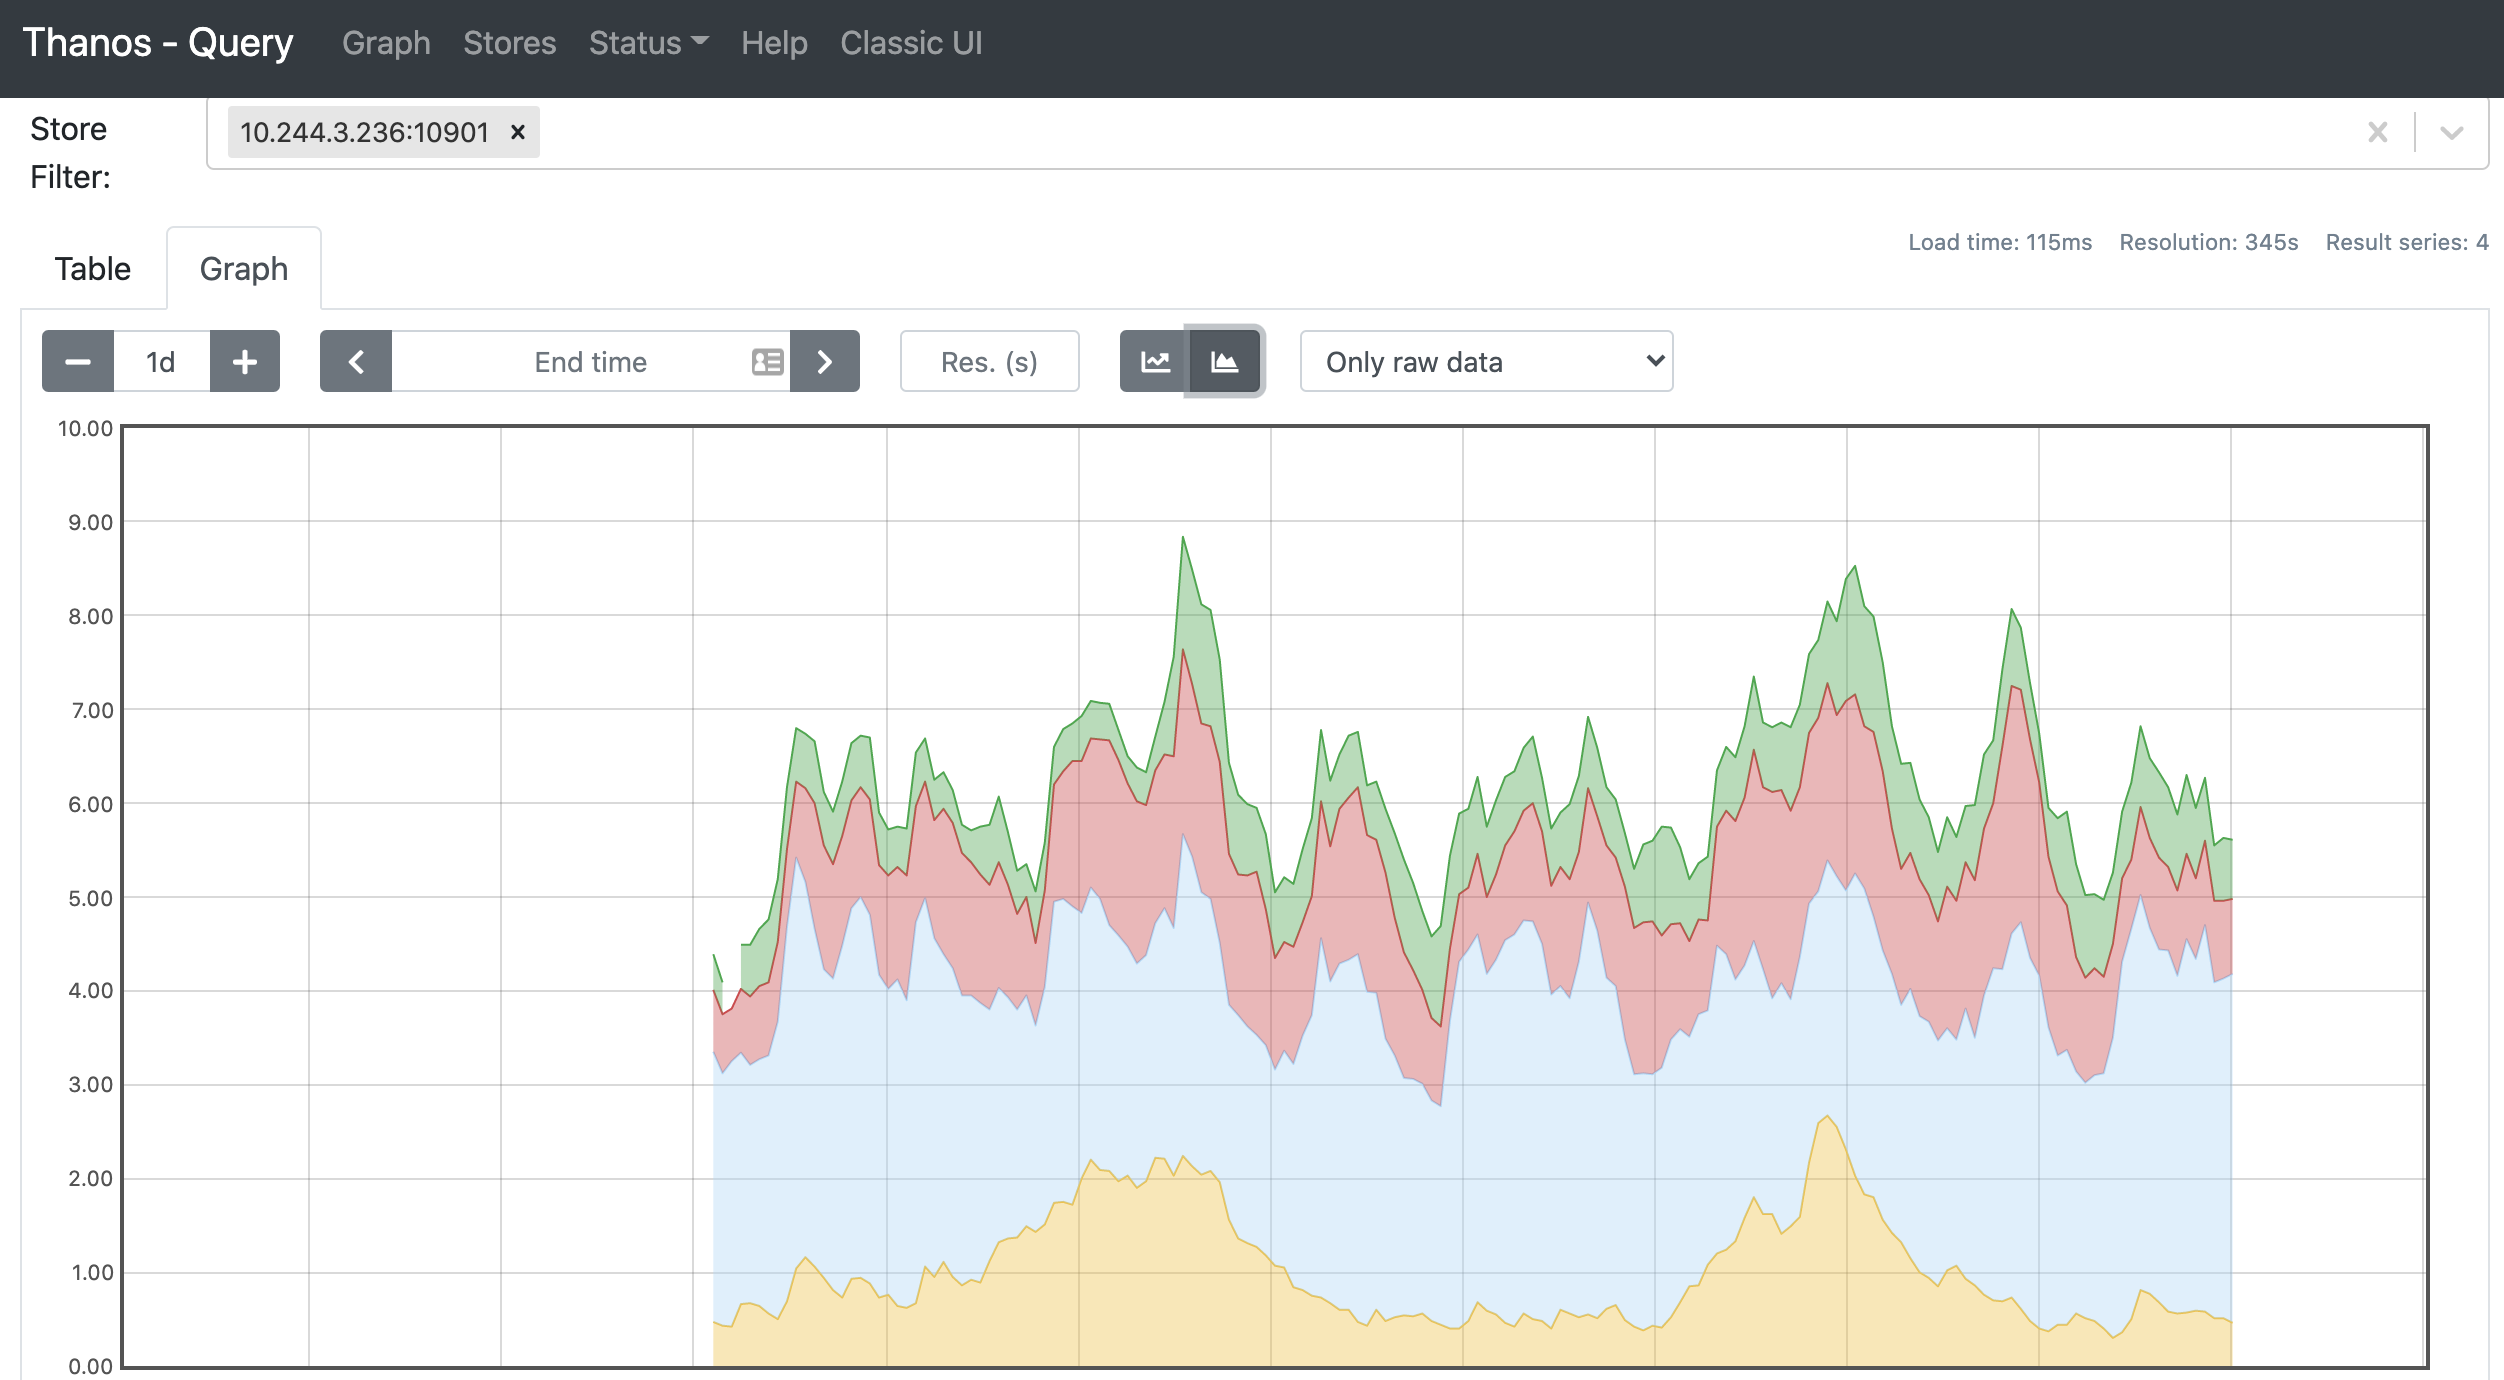
而且在 NewUI 中还可以根据 Store 来过滤要查询的数据,比如我们可以直接查询远程对象存储中的数据:
此外我们还为 Receiver 配置了 StoreObject,正常一段时间(默认还是 2h)后 Receiver 组件也会把数据上传到对象存储中去。