我们在使用 Grafana Dashboard 来展示我们的监控图表的时候,很多时候我们都是去找别人已经做好的 Dashboard 拿过来改一改,但是这样也造成了很多使用 Grafana 的人员压根不知道如何去自定义一个 Dashboard,虽然这并不是很困难。这里我们介绍一个比较新颖(骚)的工具:DARK,全称 Dashboards As Resources in Kubernetes.,意思就是通过 Kubernetes 的资源对象来定义 Grafana Dashboard,实现原理也很简单,也就是通过 CRD 来定义 Dashboard,然后通过和 Grafana 的 API Token 进行交互实现 Dashboard 的 CRUD。
下面我们来看下如何使用 DARK 定义 Grafana Dashboard。首先 Clone 项目代码:
$ git clone https://github.com/K-Phoen/dark.git
然后安装 CRD 资源:
$ kubectl apply -f k8s/crd.yaml
然后通过 Secret 对象创建 Grafana 的 API KEYS,在 Grafana 主界面中,选择左侧的配置菜单 -> API Keys 创建 API Keys,选择 Editor 的角色:
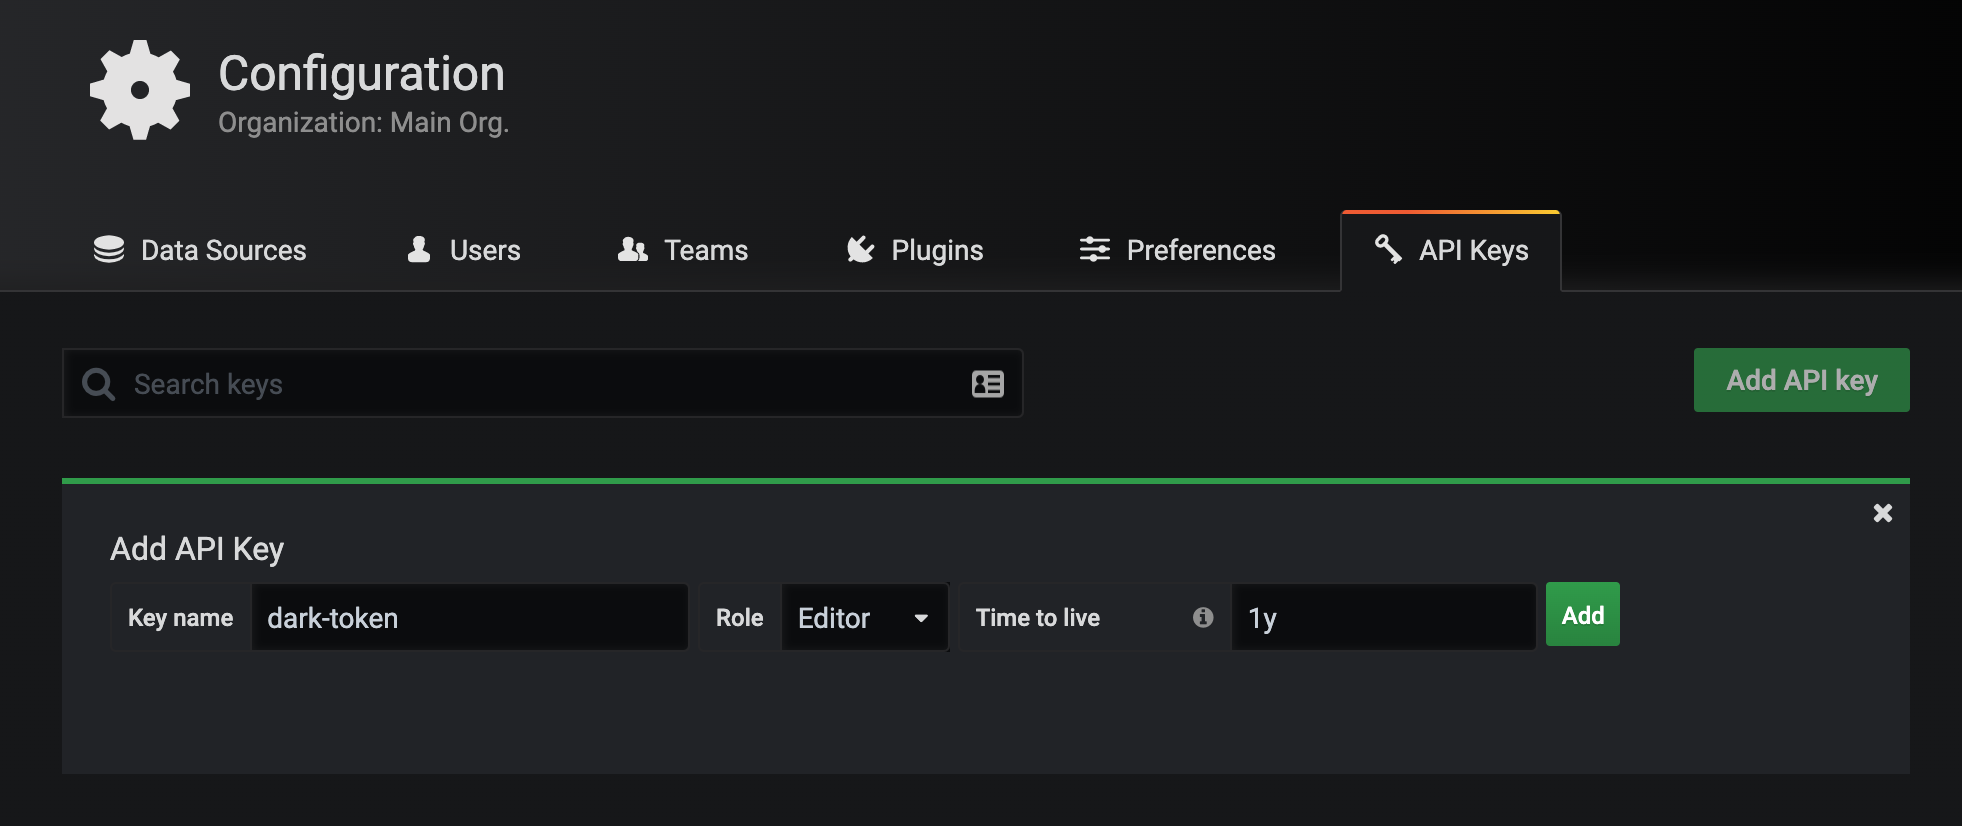
创建完成后会弹出一个对话框显示对应的 API Keys,使用这个 KEY 来创建一个对应的 Secret 对象:
$ kubectl create secret generic dark-tokens --from-literal=grafana=<替换成APIKEY>
然后修改 k8s/cluster-role.yaml 文件,如下所示:
apiVersion: v1
kind: ServiceAccount
metadata:
  name: dark
---
kind: ClusterRole
apiVersion: rbac.authorization.k8s.io/v1
metadata:
  name: dashboards-viewer
rules:
  - apiGroups: ["k8s.kevingomez.fr"]
    resources: ["grafanadashboards"]
    verbs: ["get", "watch", "list"]
  - apiGroups: [""]
    resources: ["events"]
    verbs: ["create", "patch"]
---
apiVersion: rbac.authorization.k8s.io/v1
kind: ClusterRoleBinding
metadata:
  name: dashboards-viewer-cluster
subjects:
  - kind: ServiceAccount
    name: dark
    namespace: default
roleRef:
  kind: ClusterRole
  name: dashboards-viewer
  apiGroup: rbac.authorization.k8s.io
然后创建上面的资源对象:
$ kubectl apply -f k8s/cluster-role.yaml
修改 k8s/deployment.yaml 文件,将 GRAFANA_HOST 环境变量修改成自己的 Grafana 的地址,由于我这里 Grafana 也安装在 Kubernetes 集群中的,所以直接用 DNS 形式配置,然后加上上面创建的 dark 这个 ServiceAccount:
apiVersion: apps/v1
kind: Deployment
metadata:
  name: dark
  labels:
    app: dark
spec:
  selector:
    matchLabels:
      app: dark
  template:
    metadata:
      labels:
        app: dark
    spec:
      volumes:
        - name: dark-tokens
          secret:
            secretName: dark-tokens
      serviceAccountName: dark
      containers:
        - name: dark
          image: kphoen/dark:latest
          env:
            - name: GRAFANA_HOST
              value: http://grafana.kube-mon:3000
            - name: GRAFANA_TOKEN
              valueFrom:
                secretKeyRef:
                  key: grafana
                  name: dark-tokens
修改完成后直接创建上面的 Controller:
$ kubectl apply -f k8s/deployment.yaml
$ kubectl get pods -l app=dark
NAME                    READY   STATUS    RESTARTS   AGE
dark-6bd956b8d6-755p2   1/1     Running   0          36m
现在 Controller 定义好过后,实际上我们就可以去通过 CRD 对象来定义 Grafana Dashboard 了,如下所示定义了一个 GrafanaDashboard 对象,在对象中我们完全就可以根据自己的需求去定义内容了,比如定义 annotations、variables、graph、table 都可以,当然最重要的还是数据源要正确,以及查询语句:(example-dashboards.yaml)
apiVersion: k8s.kevingomez.fr/v1
kind: GrafanaDashboard
metadata:
  name: example-dashboard
folder: "Test folder"
spec:
  title: Awesome dashboard
  editable: true
  shared_crosshair: true
  tags: [generated, yaml]
  auto_refresh: 10s
  tags_annotations:
    - name: Deployments
      datasource: "Prometheus"
      color: "#5794F2"
      tags: ["deploy", "production"]
  variables:
    - interval:
        name: interval
        label: Interval
        values: ["30s", "1m", "5m", "10m", "30m", "1h", "6h", "12h"]
    - query:
        name: status
        label: HTTP status
        datasource: Prometheus
        request: "label_values(prometheus_http_requests_total, code)"
    - const:
        name: percentile
        label: Percentile
        default: 80
        values_map:
          50th: "50"
          75th: "75"
          80th: "80"
          85th: "85"
          90th: "90"
          95th: "95"
          99th: "99"
    - custom:
        name: vX
        default: v2
        values_map:
          v1: v1
          v2: v2
  rows:
    - name: Prometheus
      panels:
        - graph:
            title: HTTP Rate
            height: 400px
            datasource: Prometheus
            targets:
              - prometheus:
                  query: "rate(promhttp_metric_handler_requests_total[$interval])"
                  legend: "{{handler}} - {{ code }}"
        - graph:
            title: Heap allocations
            height: 400px
            datasource: Prometheus
            targets:
              - prometheus:
                  query: "go_memstats_heap_alloc_bytes"
                  legend: "{{job}}"
                  ref: A
        - table:
            title: Threads
            datasource: Prometheus
            targets:
              - prometheus:
                  query: "go_threads"
            hidden_columns: ["Time"]
            time_series_aggregations:
              - label: AVG
                type: avg
              - label: Current
                type: current
        - single_stat:
            title: Heap Allocations
            datasource: Prometheus
            targets:
              - prometheus:
                  query: 'go_memstats_heap_alloc_bytes{job="prometheus"}'
            unit: bytes
            thresholds: ["26000000", "28000000"]
            color: ["value"]
    - name: "Some text, because it might be useful"
      panels:
        - text:
            title: Some awesome text?
            markdown: "Markdown syntax help: [commonmark.org/help](https://commonmark.org/help/)\n${percentile}"
        - text:
            title: Some awesome html?
            html: "Some <b>awesome</b> html?"
同样直接创建上面的示例文件:
$ kubectl apply -f example-dashboards.yaml
$ kubectl get dashboards
NAME                AGE
example-dashboard   35m
$ kubectl logs -f dark-6bd956b8d6-755p2
W0327 11:10:24.356194       1 client_config.go:543] Neither --kubeconfig nor --master was specified.  Using the inClusterConfig.  This might not work.
I0327 11:10:24.360886       1 controller.go:87] Setting up event handlers
I0327 11:10:24.362305       1 controller.go:118] Starting dark-controller
I0327 11:10:24.362341       1 controller.go:121] Waiting for informer caches to sync
I0327 11:10:24.462733       1 controller.go:126] Starting workers
I0327 11:10:24.462820       1 controller.go:132] Started workers
I0327 11:13:22.641706       1 controller.go:197] Successfully synced 'default/example-dashboard'
I0327 11:13:22.643061       1 event.go:278] Event(v1.ObjectReference{Kind:"GrafanaDashboard", Namespace:"default", Name:"example-dashboard", UID:"efc6f96f-c7fc-40b5-8b8f-831a95b0a042", APIVersion:"k8s.kevingomez.fr/v1", ResourceVersion:"48490732", FieldPath:""}): type: 'Normal' reason: 'Synced' GrafanaDashboard synced successfully
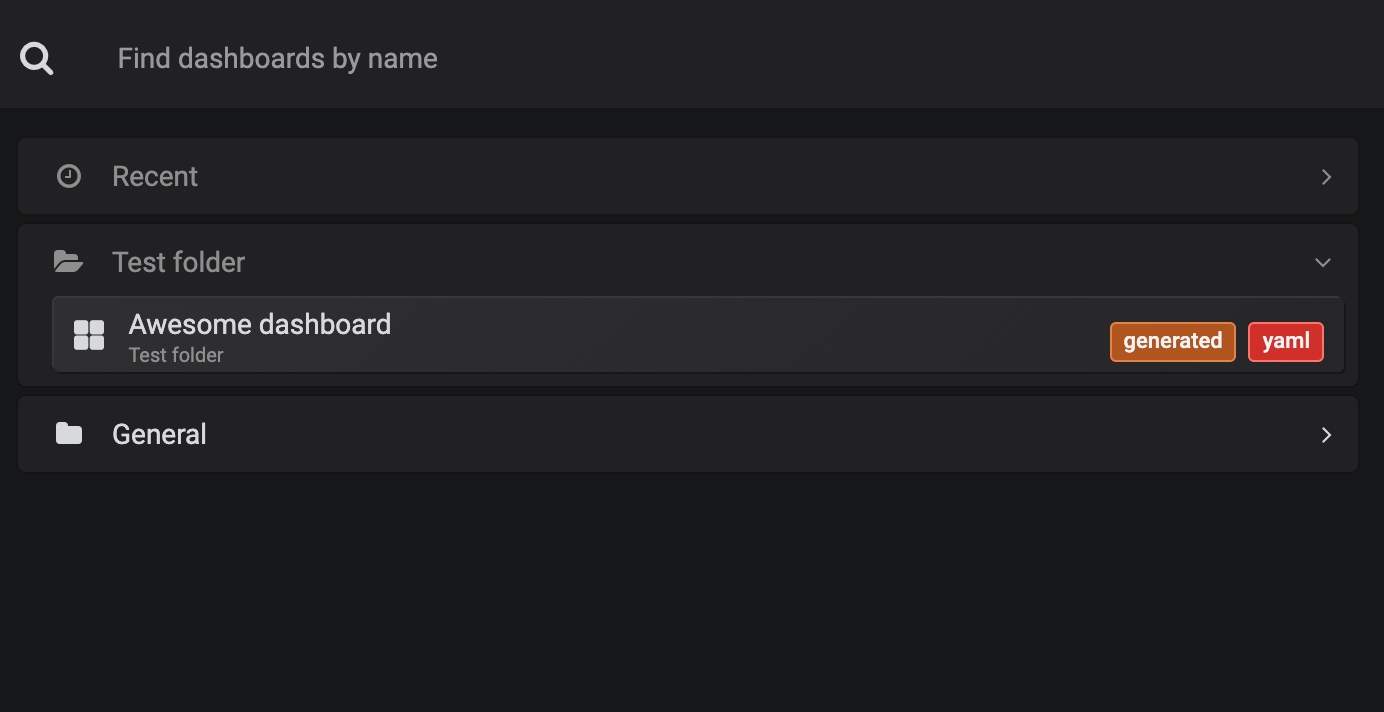
在 Controller 中也可以看到对应的日志信息,资源对象创建成功以后,现在去 Grafana 页面上查看可以看到已经新增了一个 Test folder 的文件夹以及 Awesome dashboard:
查看 Dashboard 就可以看到和上面 CRD 中定义的各种图表信息了:
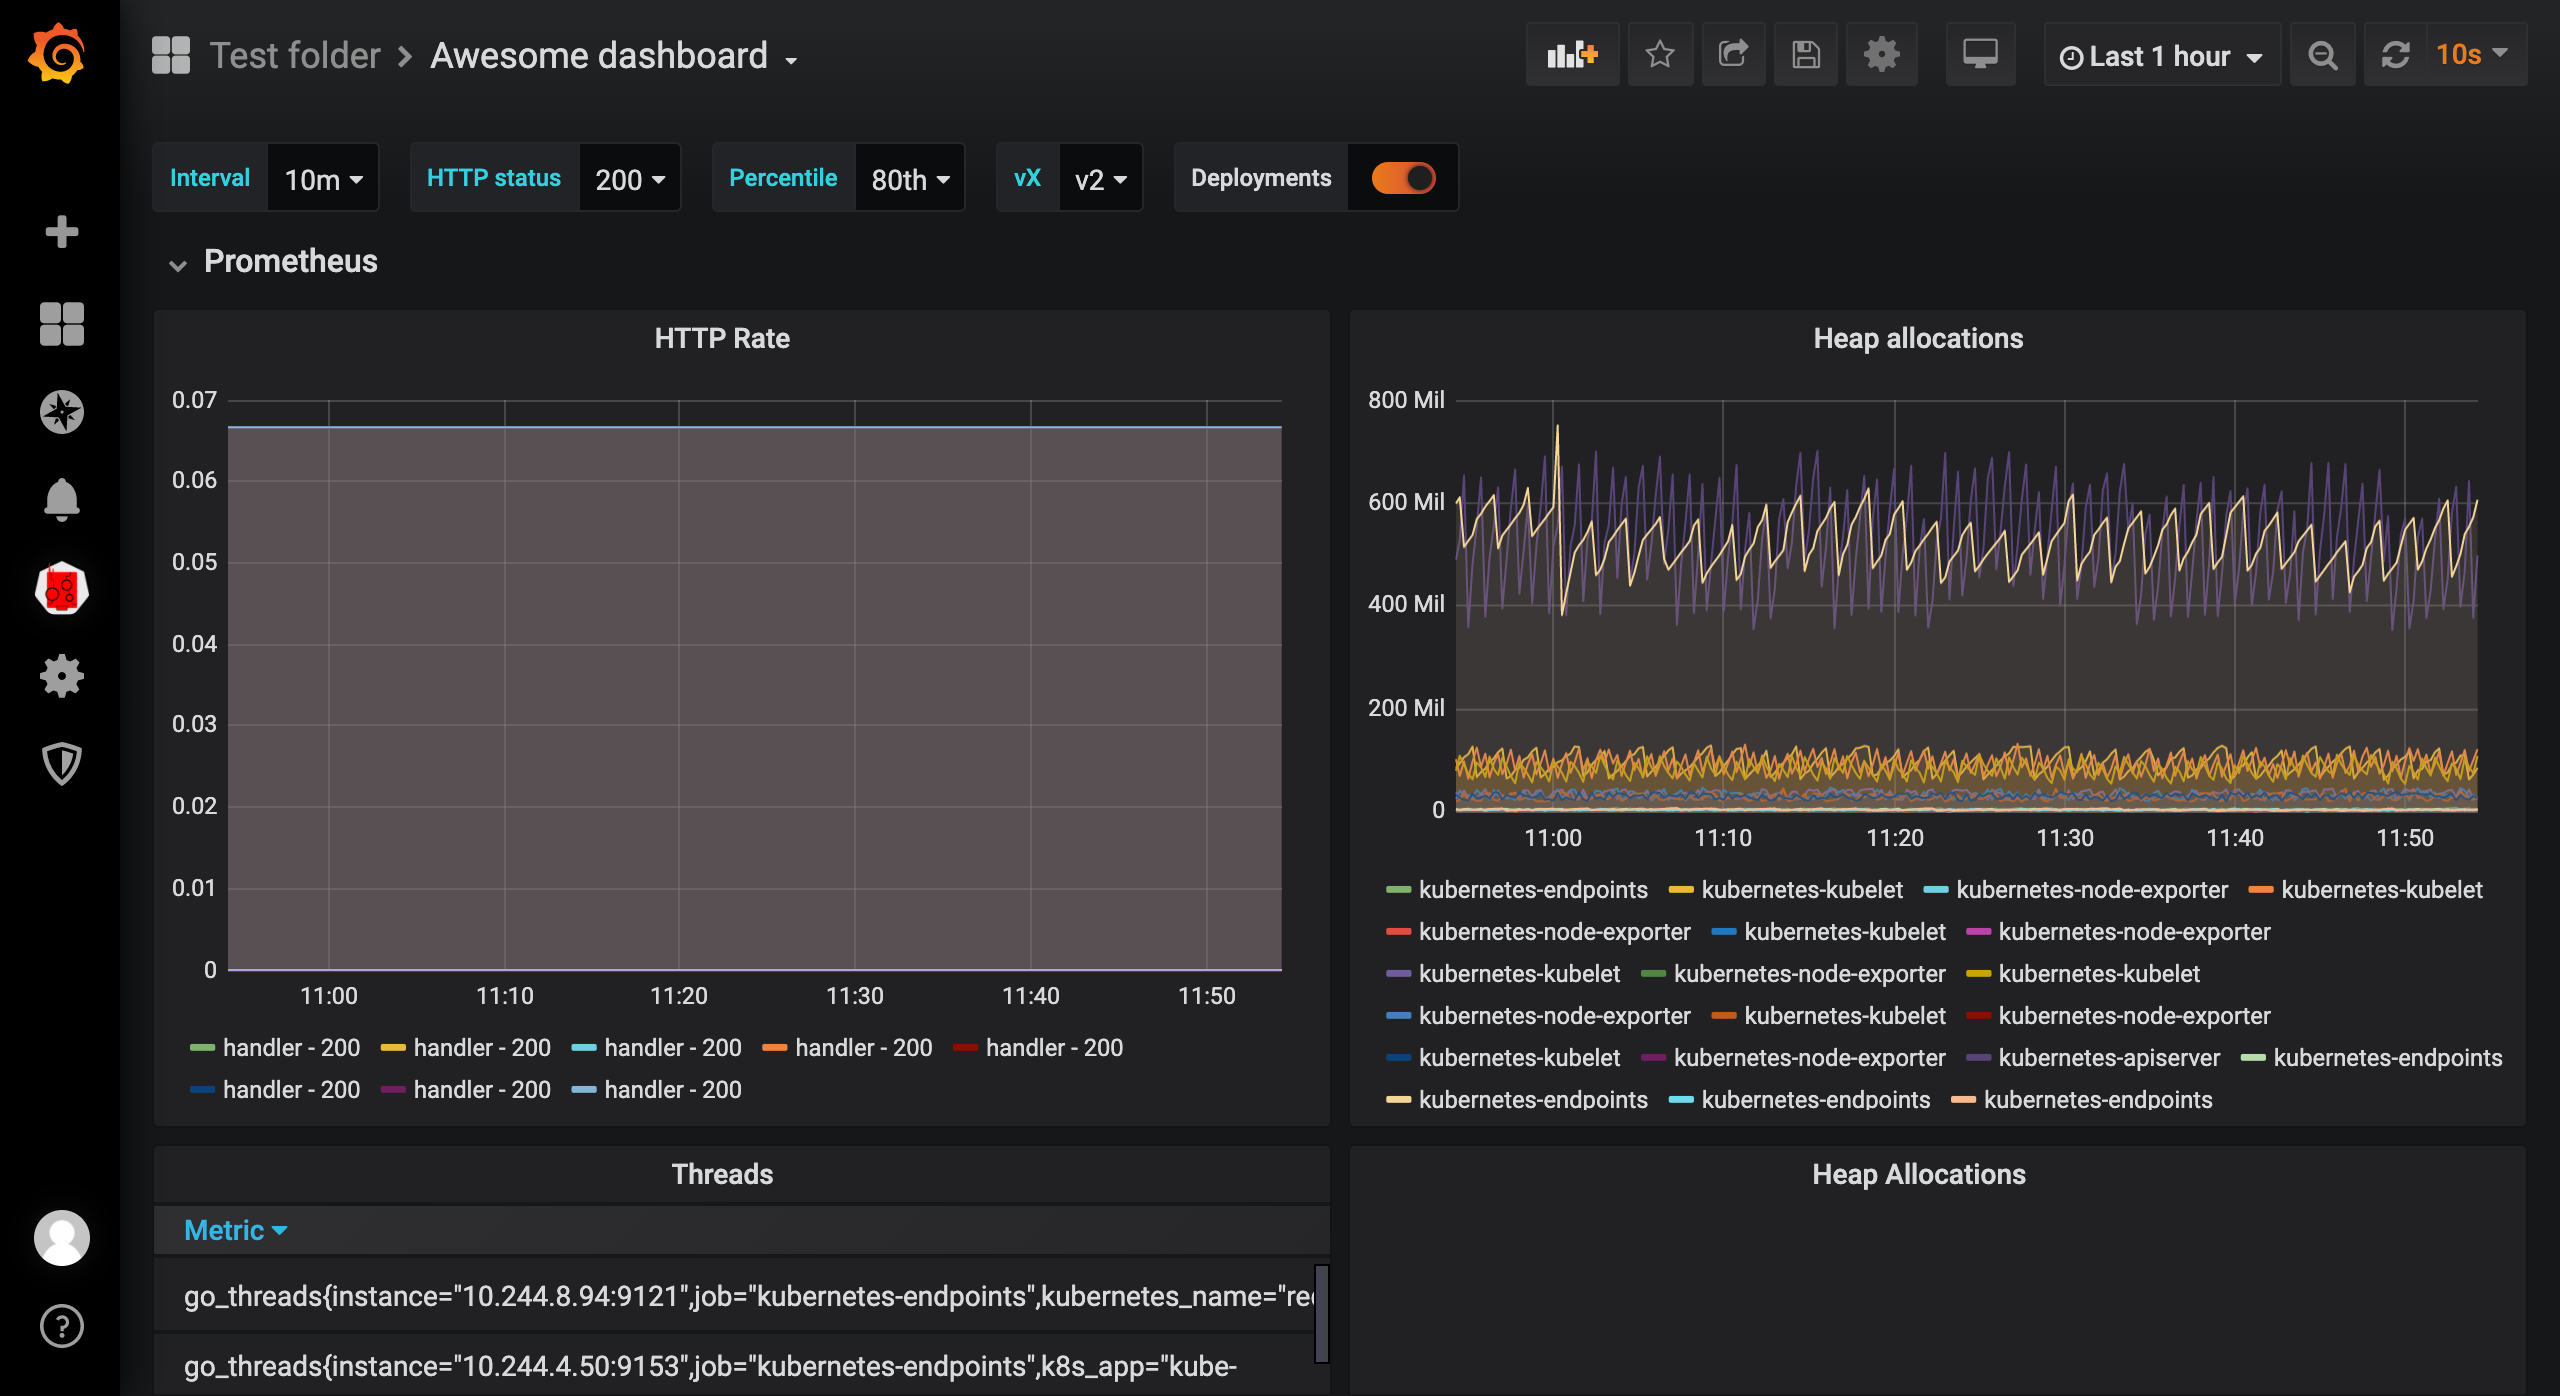
这样我们就使用 Kubernetes 资源对象去定义了 Grafana Dashboard 了,这种方式比直接在页面上去手动配置显然要更优雅,也符合 everything as code 的思想 🤯。
阳明和他朋友们的一些项目


微信公众号
扫描下面的二维码关注我们的微信公众帐号,在微信公众帐号中回复◉加群◉即可加入到我们的 kubernetes 讨论群里面共同学习。